


- ตลาดสินค้าโภคภัณฑ์เผชิญแรงกดดันจากภาวะหมี โดยมีสินทรัพย์เพียง 6 จาก 26 รายการที่ปรับตัวเพิ่มขึ้น
- ราคาน้ำมันดิบ WTI ซื้อขายอยู่ที่ 92.74 USD ต่อบาร์เรล โดยได้แรงหนุนจากความตึงเครียดด้านภูมิรัฐศาสตร์ในตะวันออกกลาง
- ทองแดงบันทึกราคาอยู่ที่ 14 393.0 USD ต่อตัน ท่ามกลางอุปทานที่ตึงตัวและสินค้าคงคลังในสหรัฐฯ ที่เพิ่มสูงขึ้น
- ราคาเงินอยู่ที่ระดับกว่า 60 USD โดยตลาดยังคงมีความต้องการทางกายภาพที่แข็งแกร่งและการถือครองในกองทุน ETF ที่อยู่ในระดับสูง
- สัญญากาแฟซื้อขายที่ระดับ 289.77 โดยเผชิญกับแรงกดดันจากผลผลิตที่ล้นตลาดและปริมาณน้ำฝนที่ดีในบราซิล

- ตลาดสินค้าโภคภัณฑ์เผชิญแรงกดดันจากภาวะหมี โดยมีสินทรัพย์เพียง 6 จาก 26 รายการที่ปรับตัวเพิ่มขึ้น
- ราคาน้ำมันดิบ WTI ซื้อขายอยู่ที่ 92.74 USD ต่อบาร์เรล โดยได้แรงหนุนจากความตึงเครียดด้านภูมิรัฐศาสตร์ในตะวันออกกลาง
- ทองแดงบันทึกราคาอยู่ที่ 14 393.0 USD ต่อตัน ท่ามกลางอุปทานที่ตึงตัวและสินค้าคงคลังในสหรัฐฯ ที่เพิ่มสูงขึ้น
- ราคาเงินอยู่ที่ระดับกว่า 60 USD โดยตลาดยังคงมีความต้องการทางกายภาพที่แข็งแกร่งและการถือครองในกองทุน ETF ที่อยู่ในระดับสูง
- สัญญากาแฟซื้อขายที่ระดับ 289.77 โดยเผชิญกับแรงกดดันจากผลผลิตที่ล้นตลาดและปริมาณน้ำฝนที่ดีในบราซิล
Commodities Market Overview
- บรรยากาศการซื้อขายในตลาดสินค้าโภคภัณฑ์วันนี้อยู่ภายใต้แรงกดดันจากฝั่งขายอย่างชัดเจน โดยมีสินทรัพย์เพียง 6 จาก 26 รายการที่ปรับตัวขึ้น ขณะที่การเปลี่ยนแปลงเฉลี่ยรายวันอยู่ที่ -0.78% สะท้อนแรงกดดันด้านอุปทาน โดยเฉพาะในกลุ่มสินค้าเกษตรและ Soft Commodities
- ในบรรดาสินทรัพย์ที่ปรับตัวลงแรงที่สุด ฝ้ายและโกโก้ โดดเด่นด้วยการลดลงมากกว่า 2%
- กลุ่มเดียวที่ยังคงปรับตัวขึ้นอย่างชัดเจนคือ โลหะมีค่า นำโดยแพลเลเดียมและทองคำ ซึ่งพยายามฟื้นตัวจากการปรับตัวลงในช่วงต้นสัปดาห์
- ขณะเดียวกัน ตัวชี้วัดทางสถิติสะท้อนความผิดปกติจากระดับในอดีตอย่างชัดเจน โดย ทองแดงและสังกะสี ยังคงอยู่สูงกว่าค่าเฉลี่ย 5 ปีอย่างมีนัยสำคัญ สวนทางกับการปรับตัวลงอย่างรุนแรงของ Lean Hogs
- ภาพรวมเศรษฐกิจมหภาคและภูมิรัฐศาสตร์ รวมถึงรายงานเกี่ยวกับความเป็นไปได้ที่สหรัฐฯ จะห้ามส่งออกดีเซล และการกลับมาส่งออกน้ำมันดิบของซาอุดีอาระเบีย กำลังสร้างความกังวลต่อเสถียรภาพของห่วงโซ่อุปทานทั่วโลก ในระยะสั้น นักลงทุนควรจับตาท่าทีเกี่ยวกับนโยบายพลังงานของสหรัฐฯ รวมถึงแนวรับทางเทคนิคที่สำคัญของตลาดโลหะมีค่า ท่ามกลางความกังวลเรื่องเงินเฟ้อที่ยังคงอยู่
- ราคาน้ำมันดิบที่สูงขึ้น ซึ่งได้รับแรงหนุนจากความตึงเครียดเกี่ยวกับอิหร่านและภัยคุกคามต่อโครงสร้างพื้นฐานในภูมิภาค กำลังกดดันให้แนวโน้มอัตราดอกเบี้ยอยู่ในระดับสูงขึ้น และส่งผลต่อสกุลเงินของประเทศที่พึ่งพาการนำเข้าพลังงาน ขณะเดียวกันยังส่งผลต่อตลาดทองคำ ซึ่งกำลังทดสอบแนวรับระยะสั้น
- ในระยะใกล้ นักลงทุนควรติดตามพัฒนาการด้านภูมิรัฐศาสตร์ในตะวันออกกลางอย่างใกล้ชิด รวมถึงผลกระทบโดยตรงต่อราคาน้ำมันและพลังงาน ซึ่งสอดคล้องกับความเห็นของเจ้าหน้าที่ธนาคารกลางยุโรป
- สำหรับตลาดสินค้าเกษตรและสินค้าอุตสาหกรรม ข่าวเกี่ยวกับนโยบายการค้าของจีนต่อสินค้าเกษตรจากสหรัฐฯ รวมถึงปัญหาด้านอุปทานในพื้นที่ เช่น ผลกระทบจาก เฮอริเคน Polo ในเม็กซิโก จะเป็นประเด็นสำคัญที่ต้องติดตามต่อไป
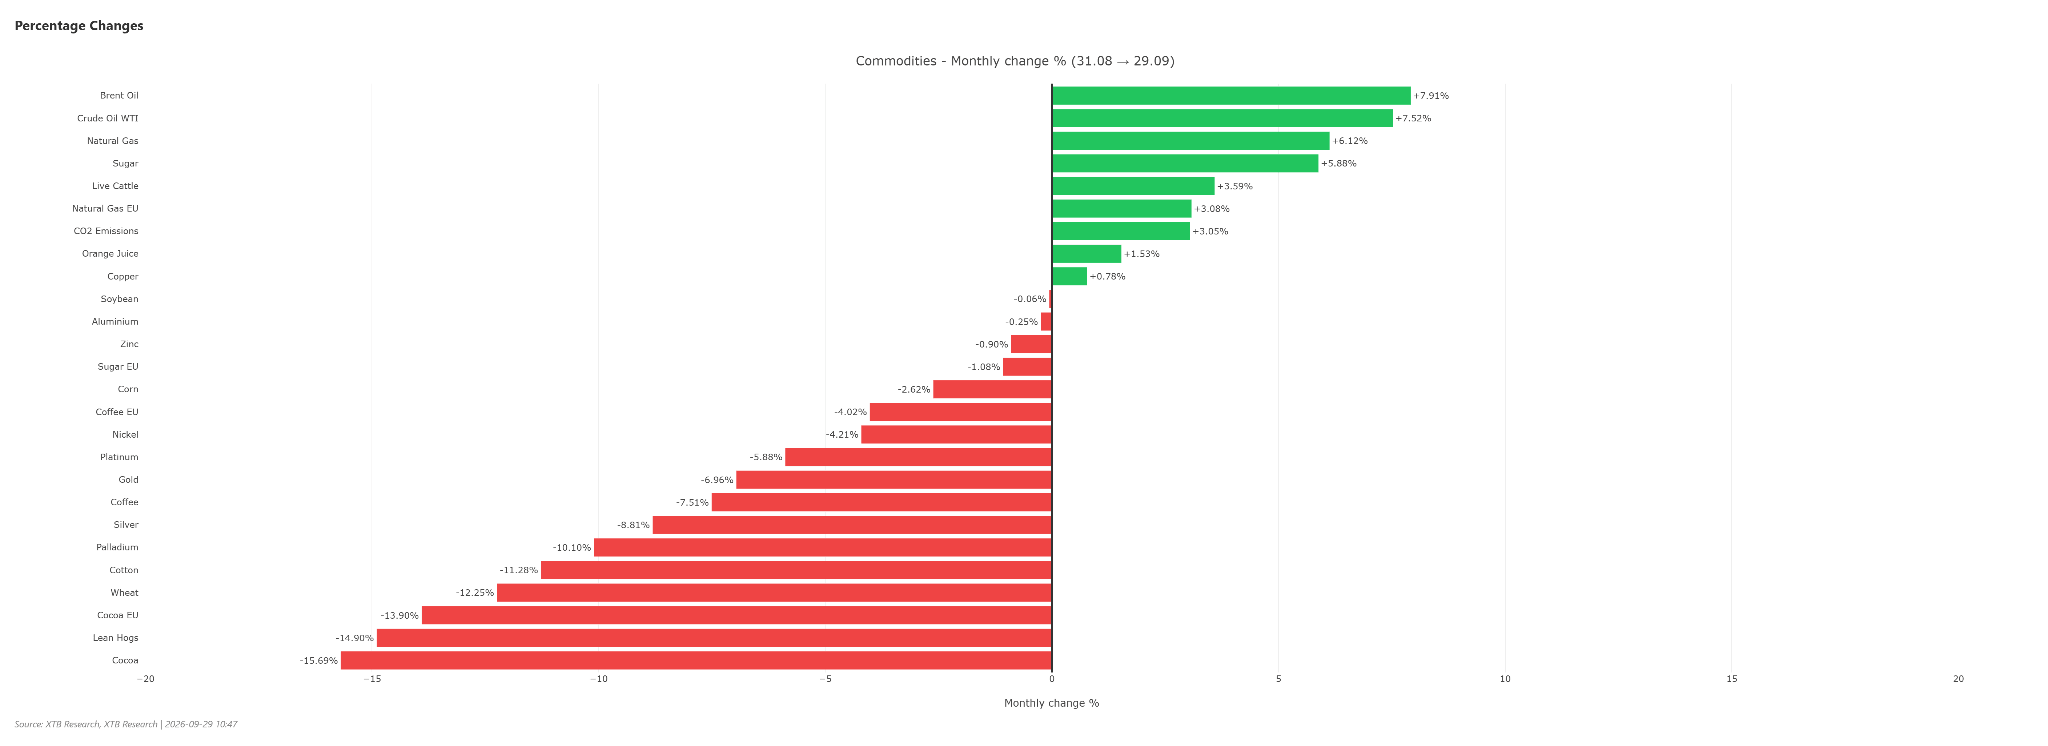 The past month brought a significant correction across commodities markets, outside the energy group. Sugar, live cattle, and orange juice also gained value. Source: XTB
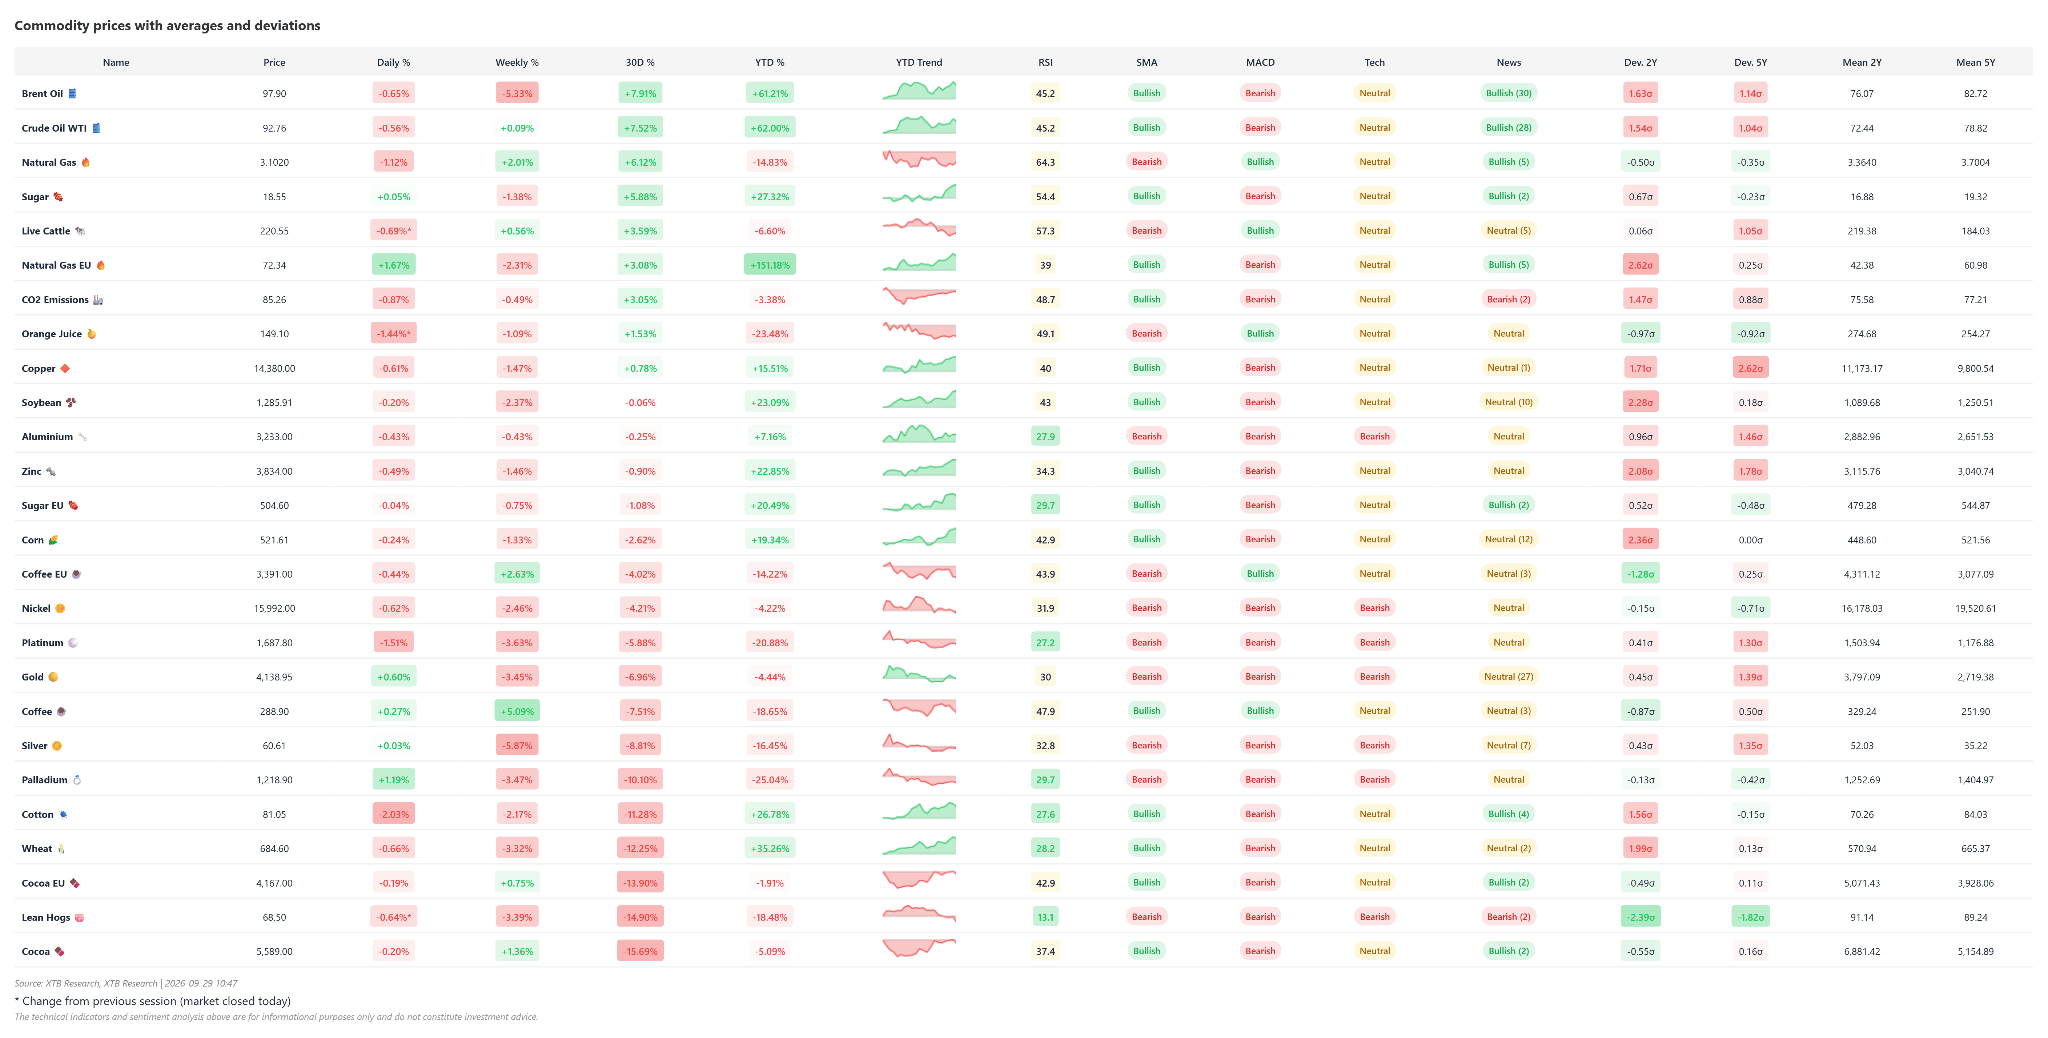 None of the commodities currently appear extremely overbought when looking at technical indicators like RSI, while many of them show a bearish bias looking at MACD. Source: XTB
Silver
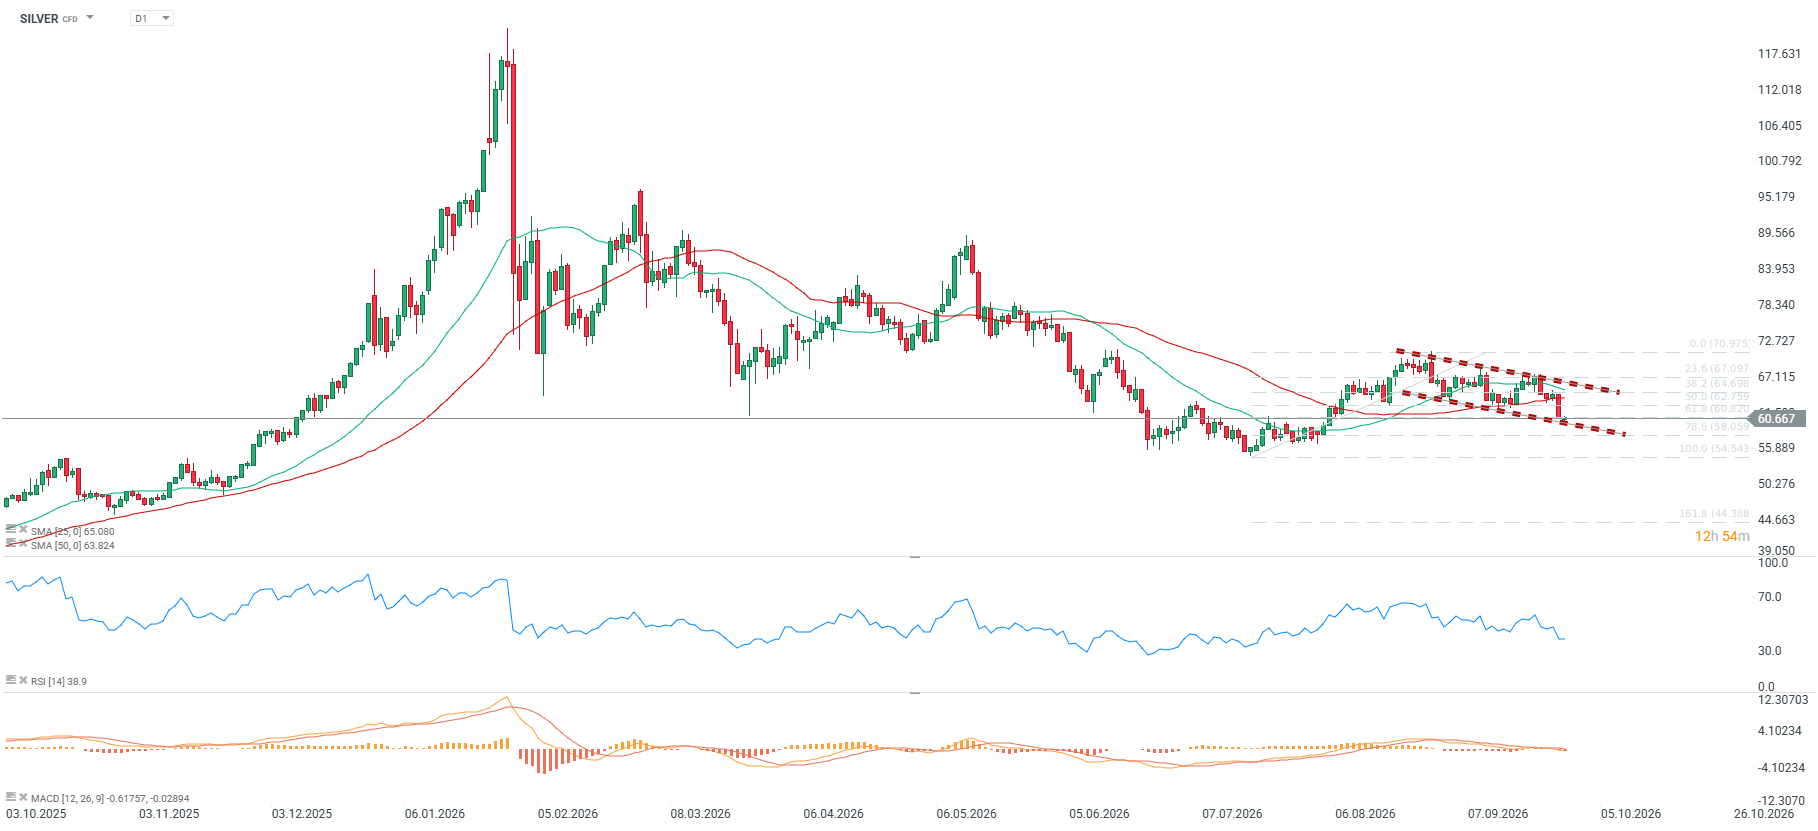
- ราคาปัจจุบันของ เงิน (Silver) อยู่เหนือระดับ $60 เล็กน้อย โดยปรับตัวลดลง 5.85% ในรอบสัปดาห์, 8.79% ในรอบเดือน และ 16.43% นับตั้งแต่ต้นปี (YTD) ขณะที่เมื่อเทียบกับช่วงเดียวกันของปีก่อน ราคายังเพิ่มขึ้น 30.03%
- ดัชนี RSI อยู่ที่ระดับ 33 ทำให้ตลาดเข้าใกล้เขต Oversold มากขึ้น ขณะที่ตัวชี้วัดทางเทคนิคสำคัญยังคงส่งสัญญาณเชิงลบ โดยเส้นค่าเฉลี่ย SMA อยู่ในภาวะ Bearish, MACD ส่งสัญญาณขาย และราคาปัจจุบันอยู่ต่ำกว่าเส้นค่าเฉลี่ย SMA50 ประมาณ 5.01% ซึ่งสะท้อนแรงกดดันฝั่งขาลง
- หากราคาหลุดระดับ $62 ต่อออนซ์ ซึ่งเป็นระดับ Retracement 50.0% แนวโน้มระยะสั้นอาจมีความเสี่ยงเป็นขาลงมากขึ้น อย่างไรก็ตาม หากสามารถรักษาระดับ $60 ได้ ก็ยังเปิดโอกาสให้แรงซื้อกลับเข้ามาและสนับสนุนการฟื้นตัวในระยะกลาง
ปัจจัยพื้นฐานและบริบทตลาด
- ความต้องการเงินในตลาดจริงกำลังแข็งแกร่งขึ้น สะท้อนจากรายงานความต้องการโลหะเงินที่เพิ่มขึ้นในตลาดซื้อขายสินค้าโภคภัณฑ์ ขณะเดียวกันกองทุน ETF ยังคงถือครองเงินในระดับสูง แม้ราคาจะถูกเทขายอย่างหนักในตลาดช่วงที่ผ่านมา
- นโยบายการเงินที่เข้มงวดของธนาคารกลางสหรัฐฯ (Fed) และจุดยืนที่ยังคง Hawkish สร้างแรงกดดันต่อสินทรัพย์ที่ไม่มีผลตอบแทนจากดอกเบี้ย โดยเฉพาะในช่วงที่อัตราผลตอบแทนพันธบัตรรัฐบาลสหรัฐฯ อยู่ในระดับสูงสุดในรอบหลายปี
- แม้จะเผชิญแรงกดดันดังกล่าว แต่ ความเชื่อมั่นของนักลงทุนสถาบันยังคงเป็นบวก โดยเฉพาะในตลาดทองคำ
- ตลาดเงินทั่วโลกกำลังเผชิญแรงกดดันโดยตรงจากปัจจัยเศรษฐกิจมหภาค ทั้งอัตราดอกเบี้ยที่อยู่ในระดับสูงและภาวะสินเชื่อที่เข้มงวดขึ้น ขณะที่การขยายตัวของสินเชื่อในจีนชะลอตัวลงอย่างมาก ซึ่งอาจกดดันราคาเงินในระยะสั้น
- วิกฤตการณ์ในตะวันออกกลาง และราคาพลังงานที่อยู่ในระดับสูงยังคงสร้างแรงกดดันด้านเงินเฟ้ออย่างต่อเนื่อง ส่งผลต่อต้นทุนการดำเนินงานของบริษัทในภาคเหมืองแร่
- สถานะการลงทุนของกองทุนเก็งกำไรสะท้อนมุมมองที่ระมัดระวังต่อโลหะเงิน โดยมี Percentile Ranking อยู่ที่ 47.3% และสัดส่วนสถานะ Long อยู่ที่ 78.9%
- การปรับตัวลงของราคาเงิน 8.79% ในรอบเดือน สอดคล้องกับ Sentiment ทางเทคนิคที่อ่อนแอลง โดย RSI ลดลงมาอยู่ที่ระดับ 33 และสร้างแรงกดดันต่อแนวรับสำคัญของราคา
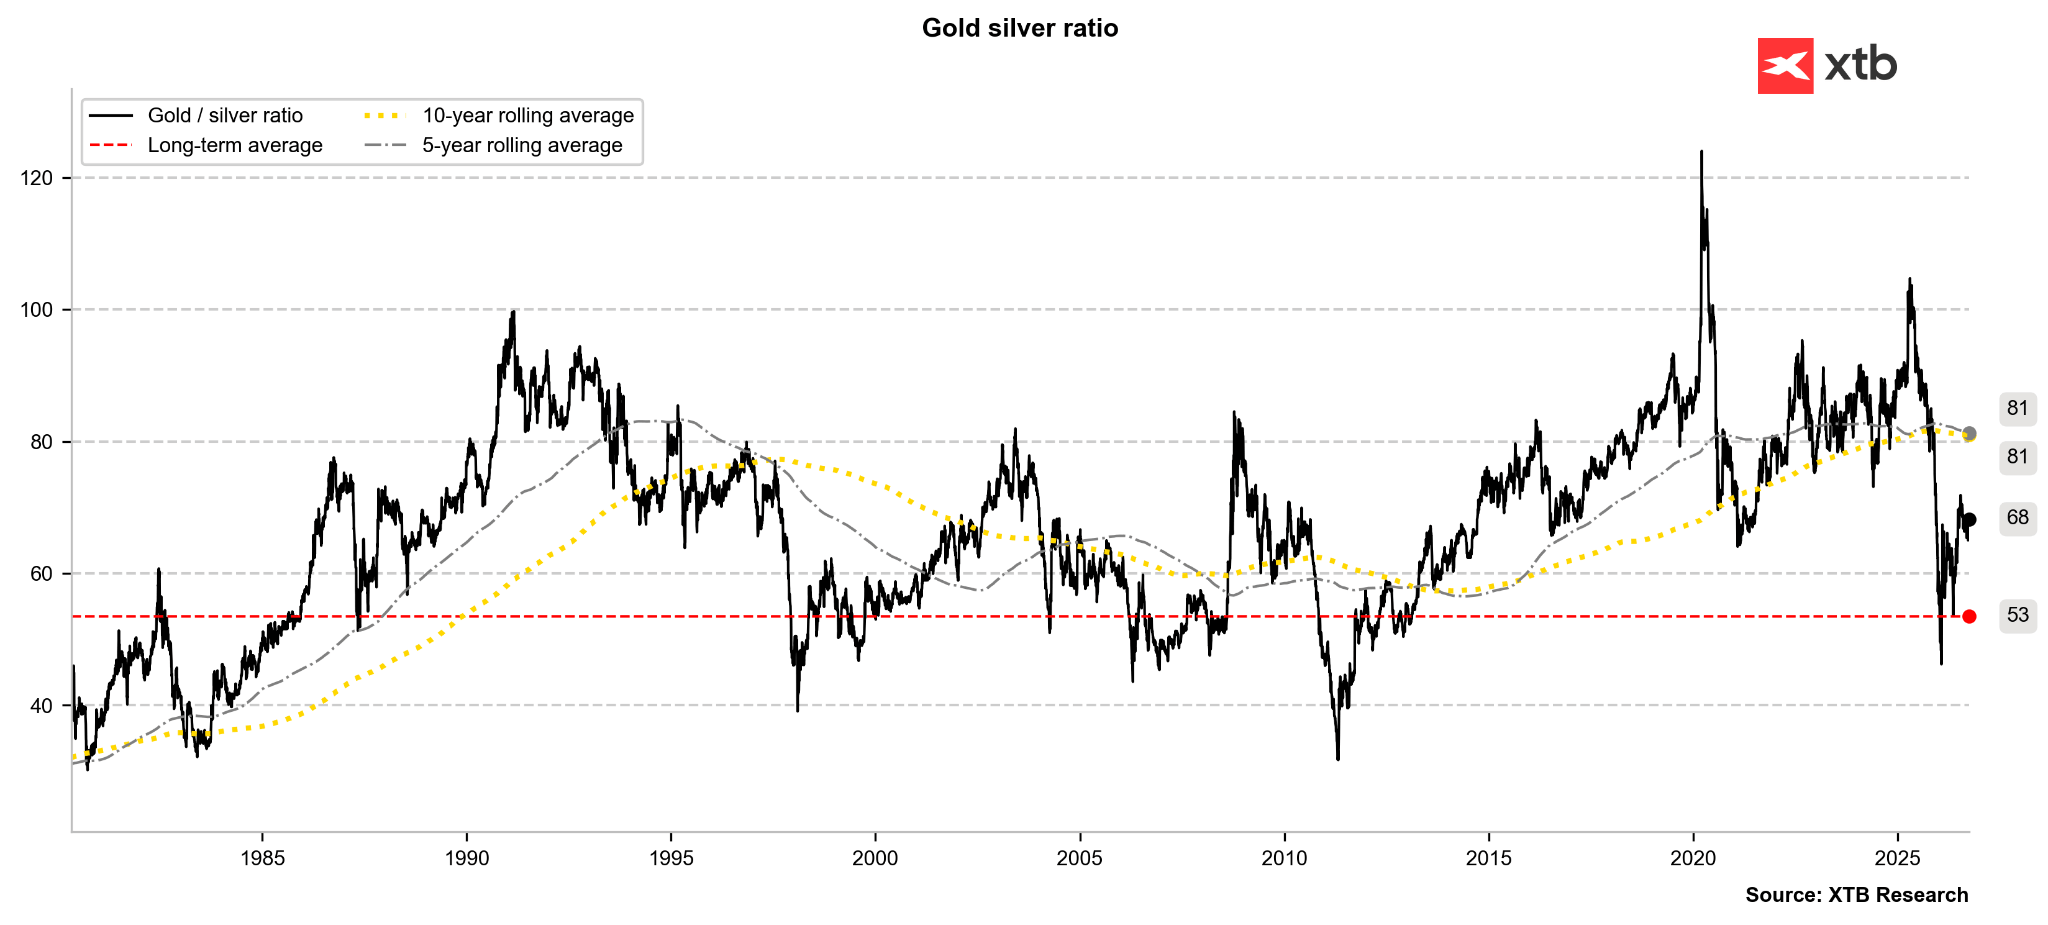
อัตราส่วน ทองคำต่อเงิน (Gold-to-Silver Ratio) ยังคงอยู่ในระดับสูงเมื่อเทียบกับช่วงไม่กี่เดือนที่ผ่านมา และแรงกดดันจากอัตราผลตอบแทนพันธบัตรที่ยังอยู่ในระดับสูงอาจผลักดันอัตราส่วนดังกล่าวขึ้นไปถึง 70 ได้
หากราคาทองคำอยู่ที่ $4,200 ต่อออนซ์ ราคาเงินที่อัตราส่วน 70 จะอยู่ที่ $60 ต่อออนซ์ พอดี ซึ่งสะท้อนว่าราคาเงินในปัจจุบันอาจอยู่ในระดับที่เหมาะสมแล้ว
ที่มา: Bloomberg Finance LP, XTB
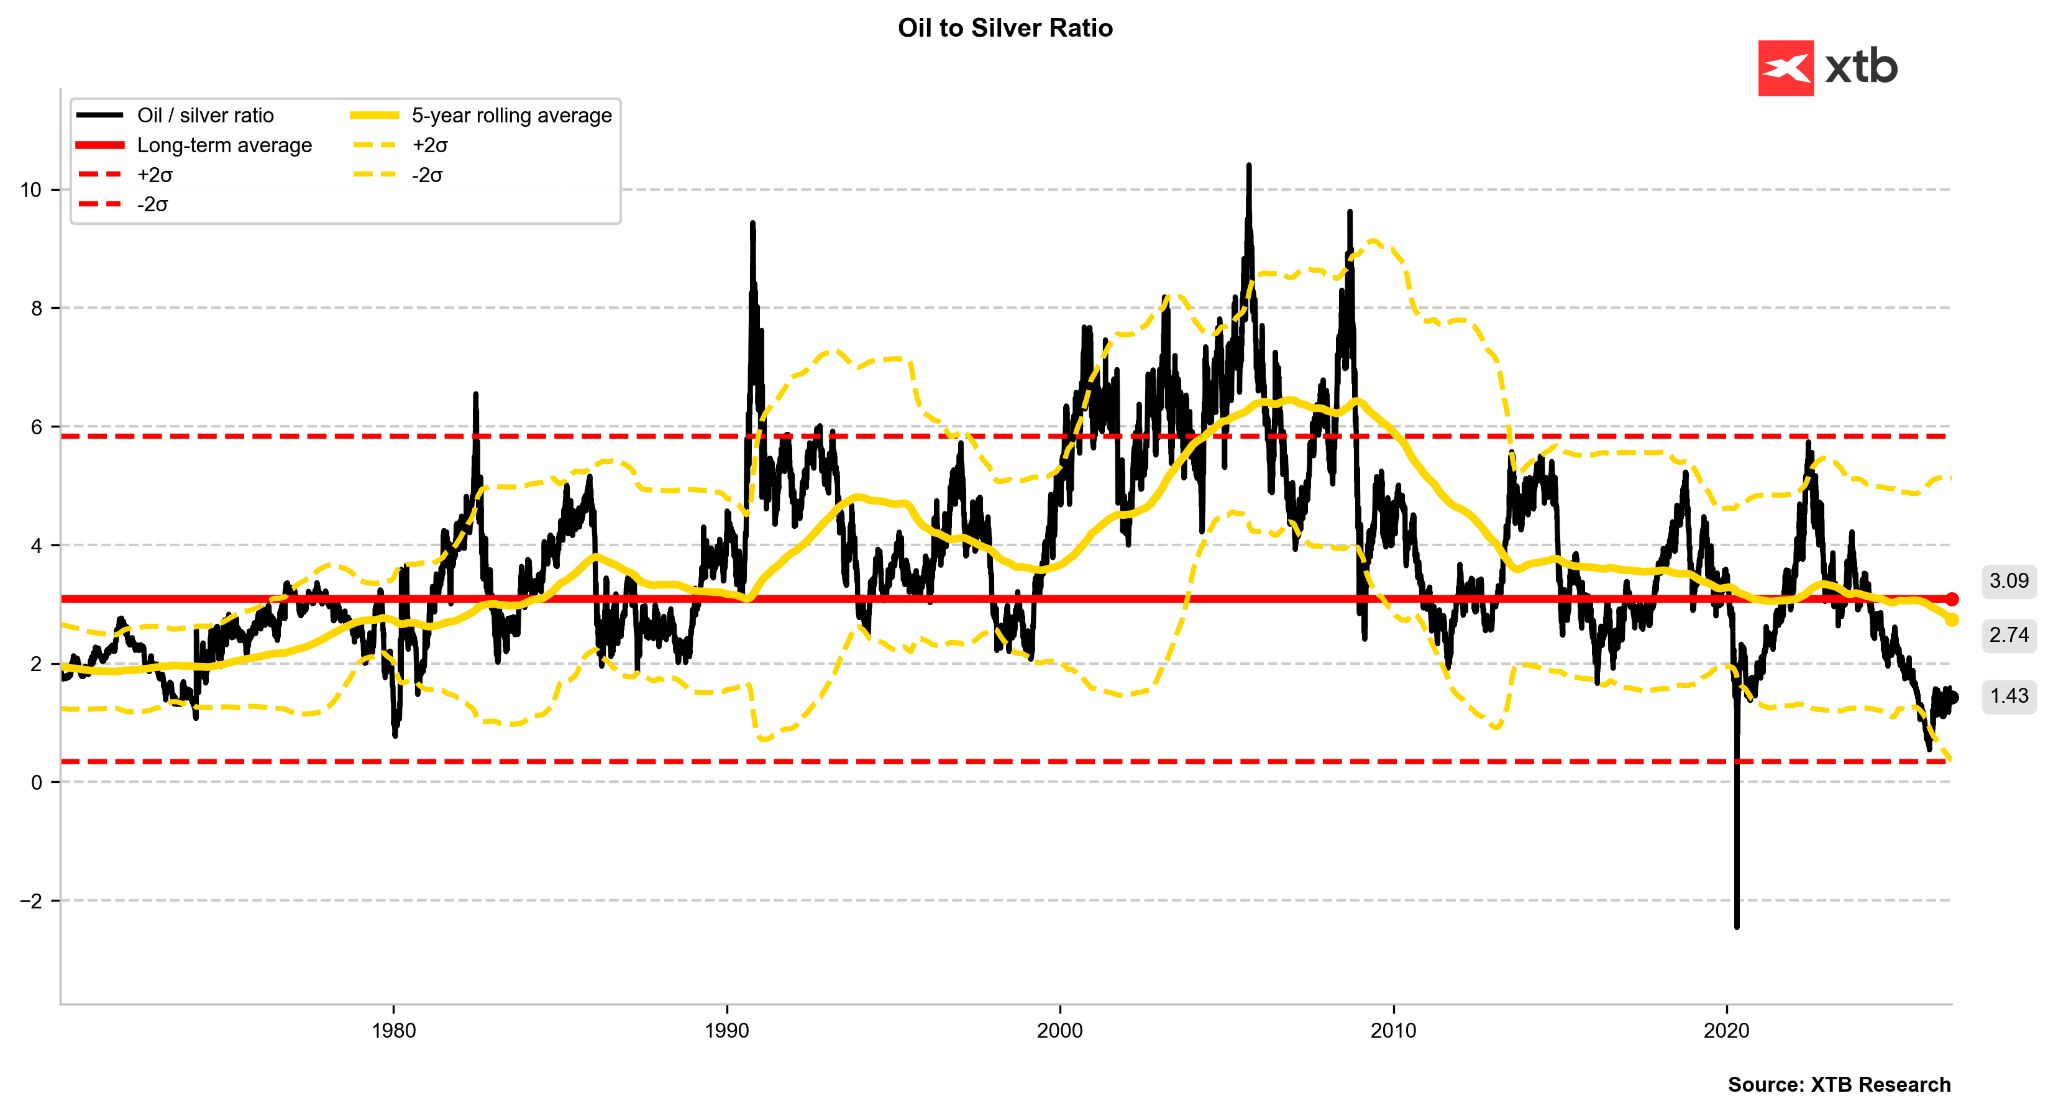 The oil-to-silver ratio remains low, somewhat reminiscent of the late 1970s. Back then, silver was recovering from a strong rebound in 1987 and subsequently pulled back for 5 years. In 1990, a sharp surge in oil prices drove the ratio up to 9. Source: Bloomberg Finance LP, XTB
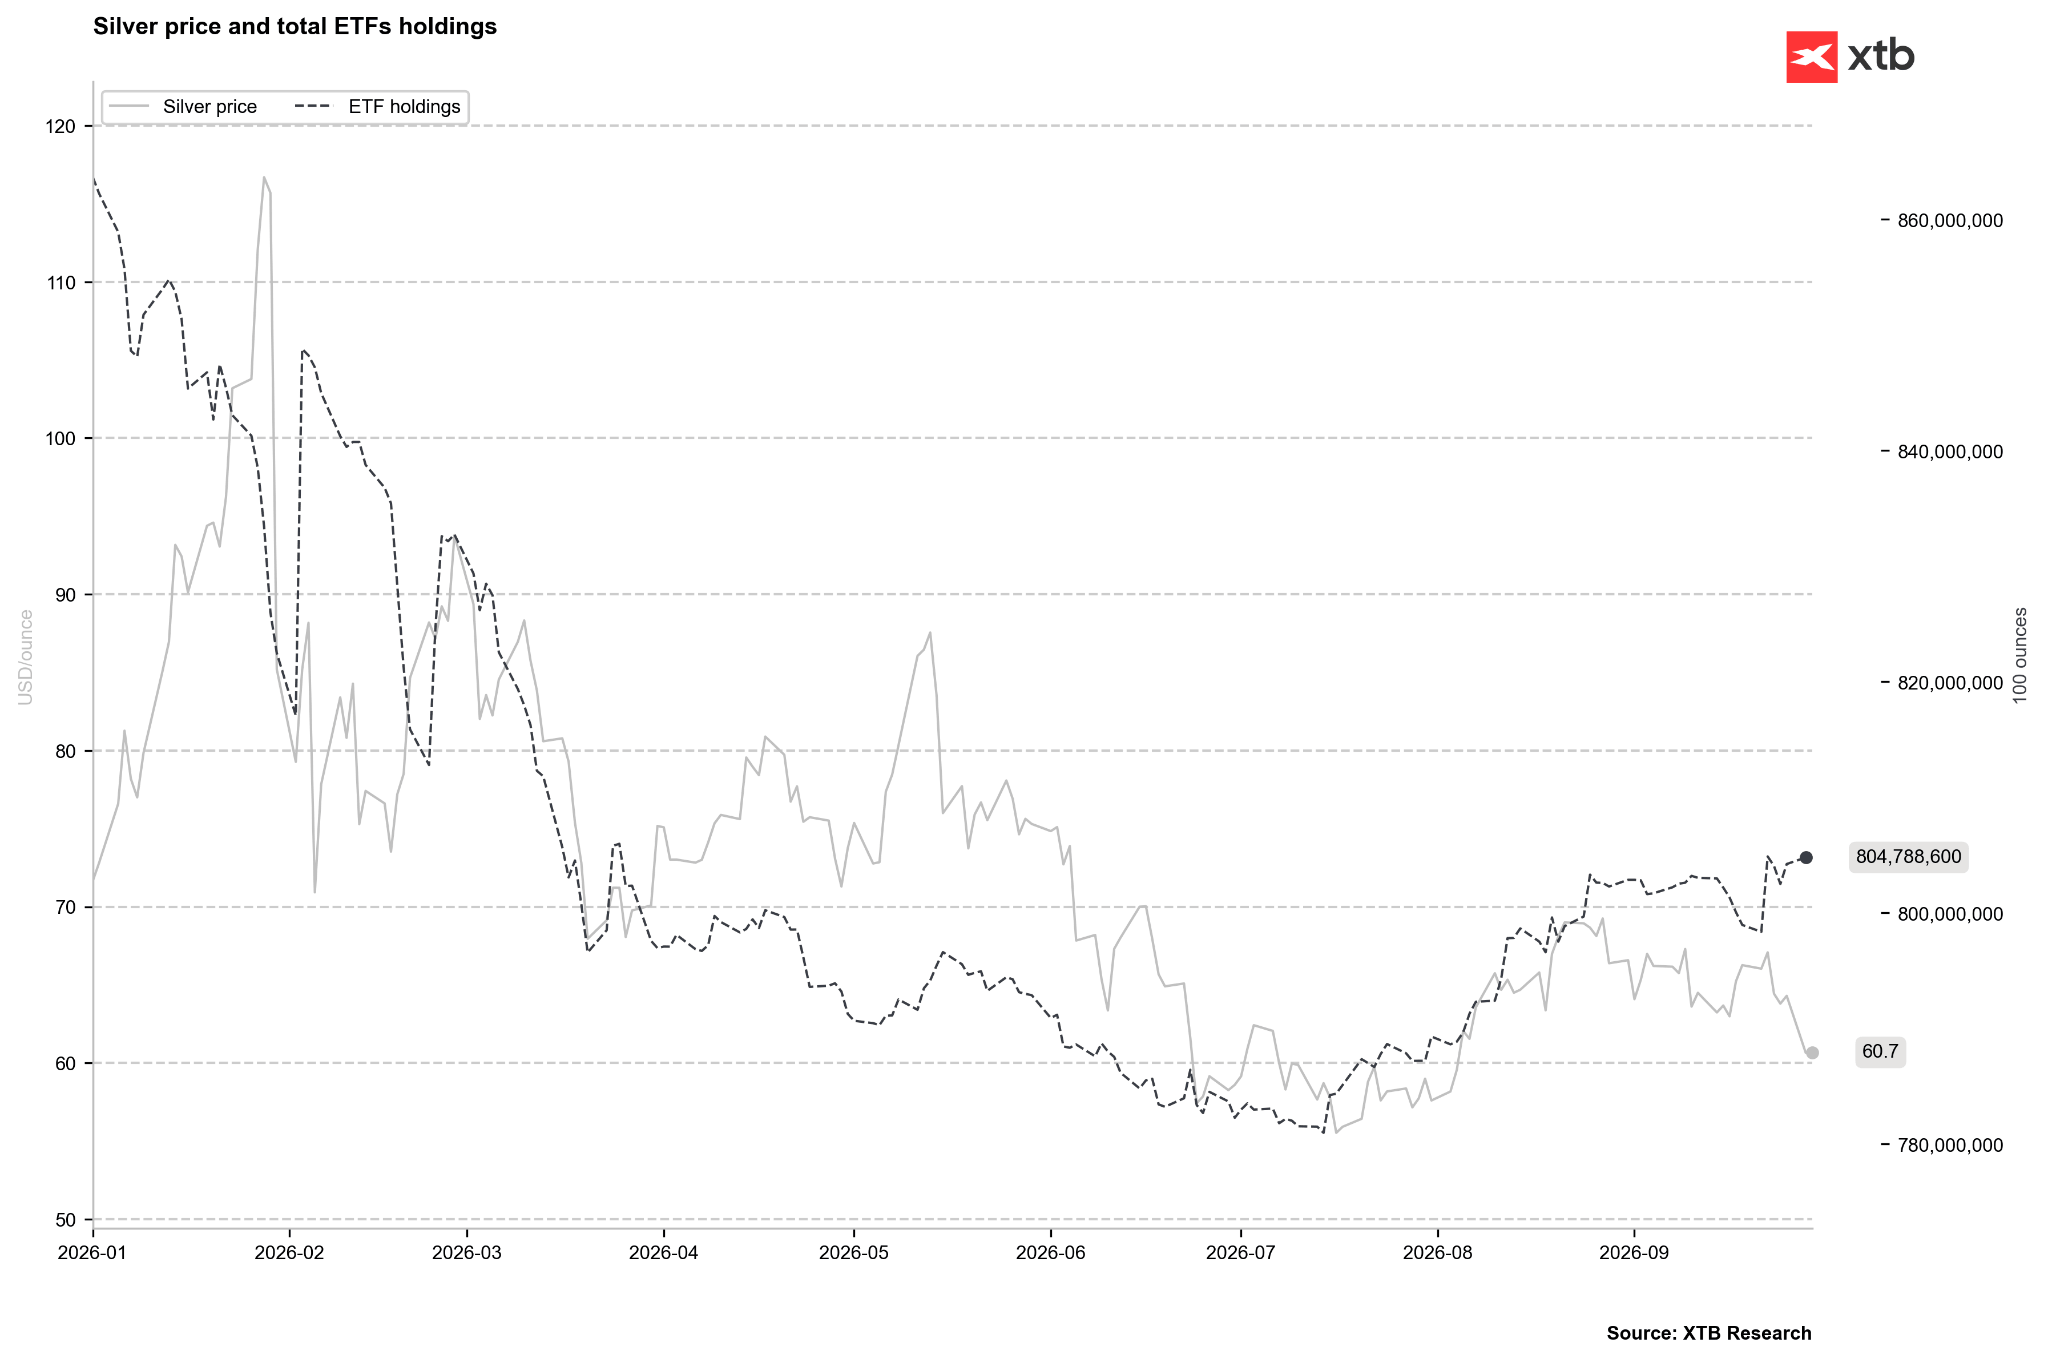
- ความหวังของฝั่งขาขึ้นยังอยู่ที่ การถือครองเงินของกองทุน ETF ในระดับสูง ซึ่งอาจบ่งชี้ว่าการปรับตัวลงของราคาในครั้งนี้อาจเป็นเพียงชั่วคราว อย่างไรก็ตาม หากกองทุนเริ่มลดการถือครองและมีแรงขายเพิ่มเติม ก็ไม่สามารถตัดความเป็นไปได้ที่ราคาเงินจะปรับตัวลงต่ำกว่า $55 ต่อออนซ์ ได้
ที่มา: Bloomberg Finance LP, XTB
มูลค่าในอดีต (Z-score) และสถานะการลงทุนของ CFTC
- ค่า Z-score ของราคาเงิน อยู่ที่ -0.67 ในกรอบเวลา 1 ปี (Z1Y), +0.43 ในกรอบเวลา 2 ปี (Z2Y) และ +1.35 ในกรอบเวลา 5 ปี (Z5Y)
- เมื่อพิจารณาพัฒนาการของ Z-score ในกรอบ 5 ปี พบว่าตัวชี้วัดดังกล่าวอยู่ที่ 2.54 เมื่อ 6 เดือนก่อน ก่อนลดลงมาอยู่ที่ 1.41 เมื่อ 3 เดือนก่อน ขยับขึ้นมาอยู่ที่ 1.73 เมื่อ 1 เดือนก่อน และล่าสุดลดลงมาอยู่ที่ 1.35 สะท้อนว่า Premium ของราคาเงินเมื่อเทียบกับระดับในอดีตกำลังค่อย ๆ ลดลง
- ข้อมูล CFTC ณ วันที่ 22 กันยายน 2026 ระบุว่า สถานะสุทธิของนักลงทุนเก็งกำไรอยู่ที่ 25,444 สัญญา โดยมี Z-score ที่ -1.05 และอยู่ที่ Percentile 47.3% เมื่อเทียบกับข้อมูลในอดีต
- สถานะการลงทุนเพิ่มขึ้น 118 สัญญาในรอบสัปดาห์ ขณะที่สัดส่วนสถานะ Long อยู่ที่ 78.9%
- เมื่อนำข้อมูลทั้งสองด้านมาพิจารณาร่วมกัน พบสัญญาณที่แตกต่างกันในระดับปานกลาง โดย Z-score ของสถานะเก็งกำไรที่ติดลบและอยู่ใกล้ Percentile ที่ 47% ประกอบกับ RSI ที่ระดับ 33 สะท้อนว่าตลาดอาจอยู่ในภาวะ Oversold ในระยะสั้น อย่างไรก็ตาม การที่สัญญาซื้อขายล่วงหน้ายังไม่ได้อยู่ในระดับที่ถูกประเมินต่ำเกินไปอย่างรุนแรง ทำให้โอกาสเกิด Short Squeeze อย่างรวดเร็วในทันทีมีข้อจำกัด
- ขณะเดียวกัน การปรับตัวลงของราคาเงินพร้อมกับค่า Z-score ในระยะยาวที่ลดลง สะท้อนว่าแรงกดดันด้านราคาในปัจจุบันมีปัจจัยรองรับจาก กระแสเงินทุนในตลาด อยู่พอสมควร
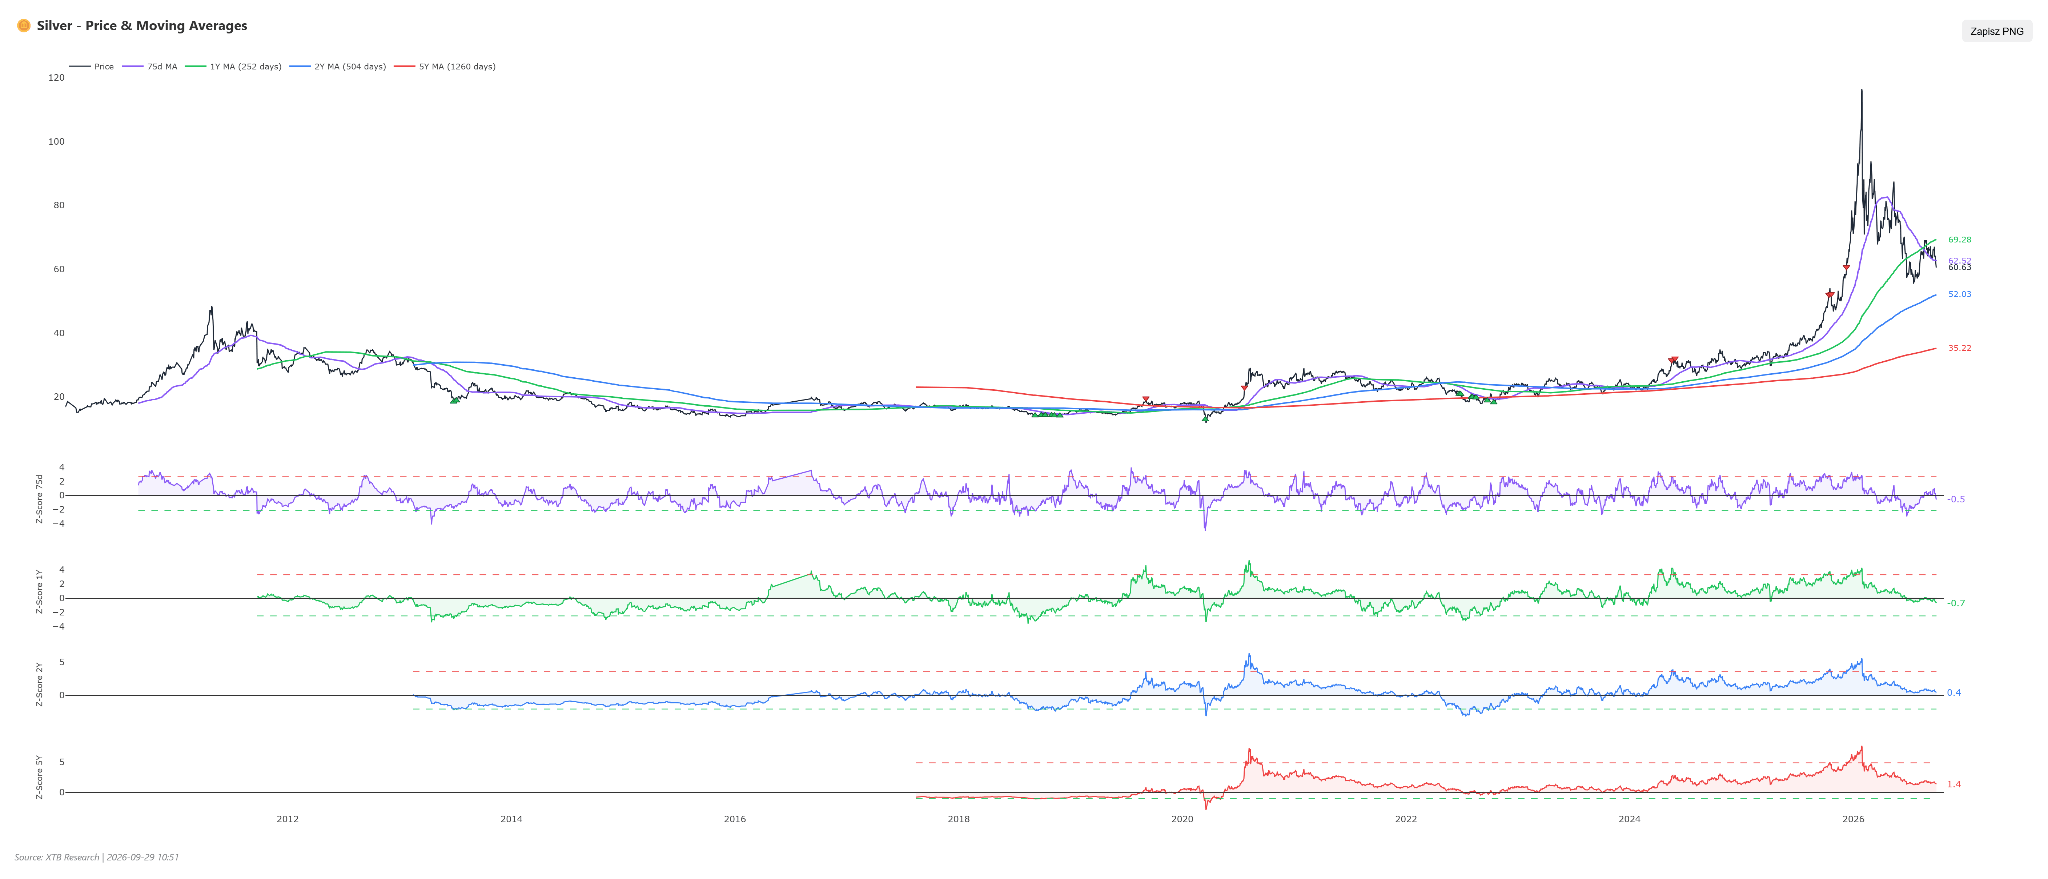 Silver is currently not showing large deviations from moving averages. Source: XTB
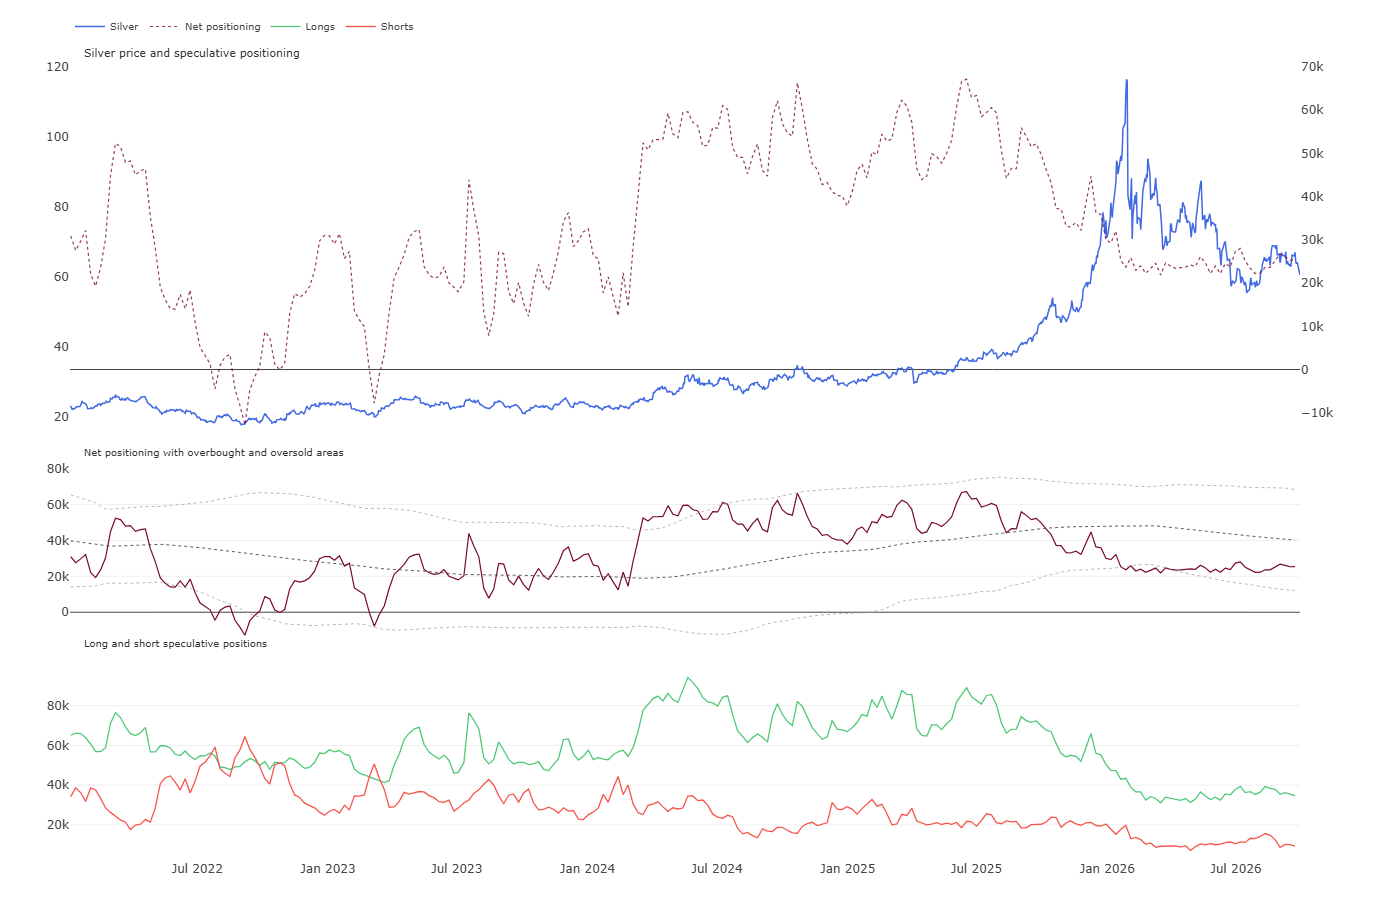
โดยพื้นฐานแล้ว ตั้งแต่เดือนกรกฎาคมปีที่แล้ว เราเห็นการลดลงของ สถานะ Long อย่างชัดเจน ปัจจุบัน Open Interest ยังคงอยู่ในระดับต่ำ ขณะที่สถานะสุทธิยังเบี่ยงเบนต่ำกว่าค่าเฉลี่ย แต่ยังไม่อยู่ในภาวะ Oversold ที่รุนแรงเหมือนในไตรมาส 1 ของปีนี้
ที่มา: Bloomberg Finance LP, XTB
สถานการณ์ที่อาจเกิดขึ้น
🟢 กรณีขาขึ้น (Bullish Scenario)
แนวโน้มขาขึ้นจะมีโอกาสเกิดขึ้นหากแรงกดดันจากอัตราผลตอบแทนพันธบัตรรัฐบาลสหรัฐฯ ผ่อนคลายลง และราคาสามารถทะลุแนวต้านทางเทคนิคบริเวณ SMA50 ได้อย่างต่อเนื่อง โดยจำเป็นต้องได้รับแรงหนุนจากเงินทุนไหลเข้าสู่กองทุน ETF และ RSI ฟื้นตัวเหนือระดับ 50
หากปัจจัยเหล่านี้เกิดขึ้นพร้อมกัน ราคามีโอกาสเคลื่อนไหวขึ้นไปทดสอบแนวต้านบริเวณ $64.50 และอาจกลับไปหาโซน High ใกล้ $68.00
🔴 กรณีขาลง (Bearish Scenario)
แนวโน้มขาลงอาจเกิดขึ้นหากนโยบายการเงินยังคงมีท่าที Hawkish และราคาปรับตัวลงหลุดแนวรับทางเทคนิคสำคัญเพิ่มเติม โดยเมื่อพิจารณาจากโครงสร้างของ SMA และ MACD ที่ยังเป็นลบ รวมถึง RSI ที่ลดลงต่ำกว่า 33 อาจเปิดทางให้เกิดแรงขายเพิ่มเติม
ในกรณีดังกล่าว ราคาอาจปรับตัวลงมาทดสอบระดับ $57.00 และหากแรงขายเร่งตัวขึ้น อาจมีโอกาสลงไปถึง $54.20
Copper
- ปัจจุบันราคาทองแดงอยู่ที่ $14,393.0 ต่อตันเมตริก โดยราคาปรับตัวลดลง 1.38% ในรอบสัปดาห์ ขณะที่เมื่อเทียบกับเดือนก่อนยังเพิ่มขึ้น 0.87%
- นับตั้งแต่ต้นปี (YTD) ราคาทองแดงเพิ่มขึ้น 15.62% และเมื่อเทียบกับช่วงเดียวกันของปีก่อน เพิ่มขึ้นถึง 39.77%
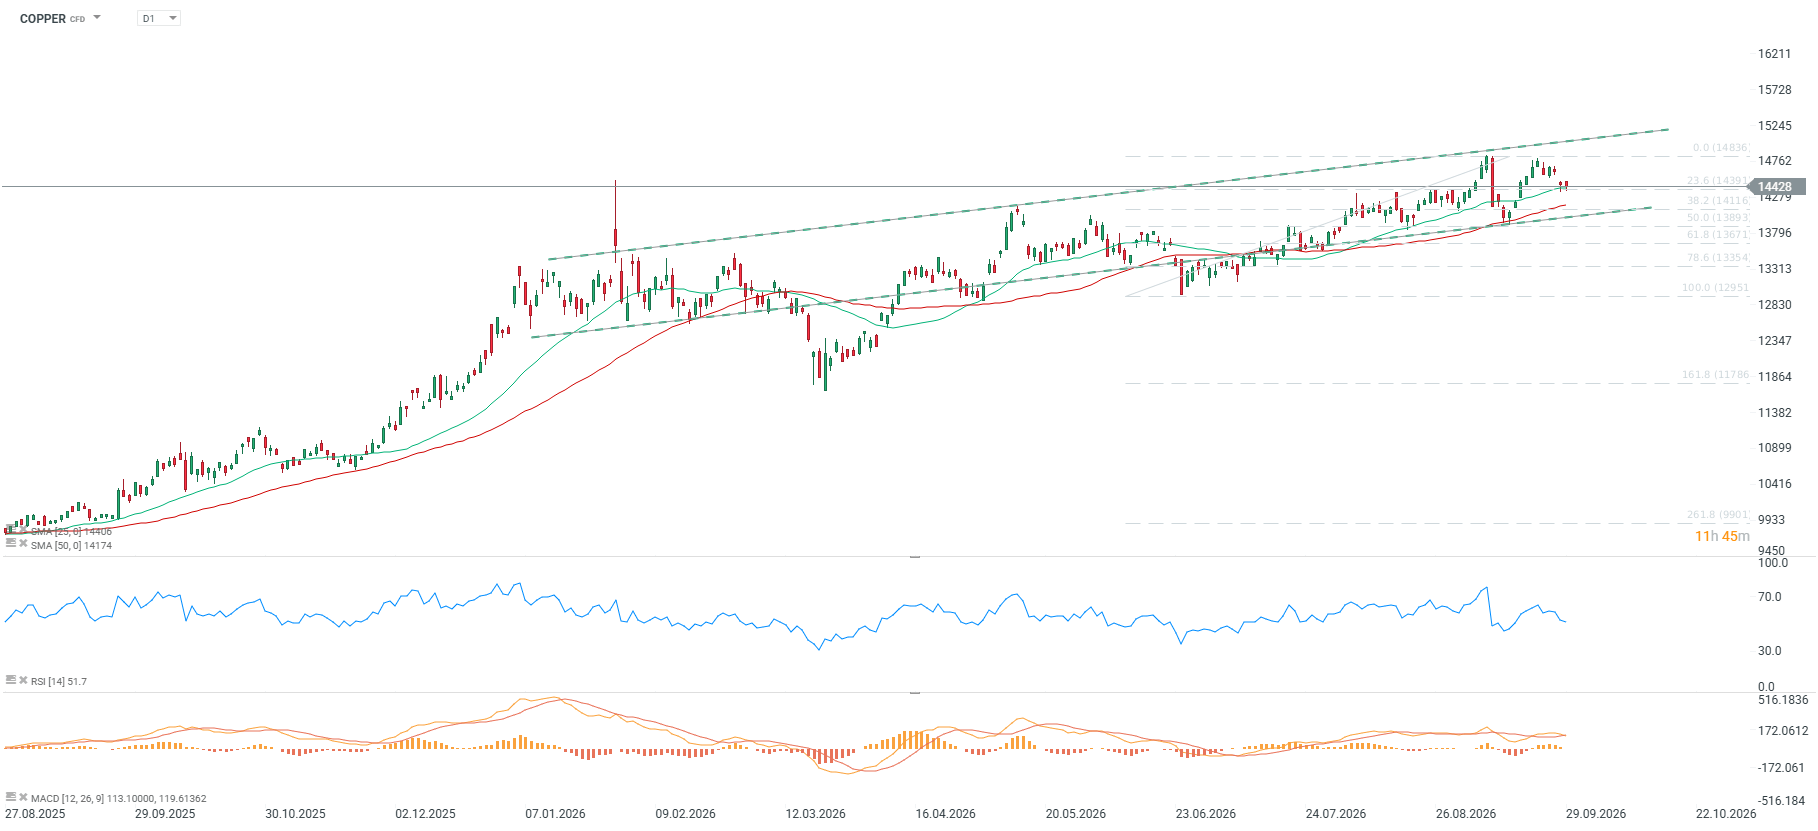
- ดัชนี RSI อยู่ที่ระดับ 40 ขณะที่เส้นค่าเฉลี่ย SMA ยังคงส่งสัญญาณเชิงบวก โดยราคาสูงกว่า SMA50 อยู่ 1.54% ส่วน MACD ยังคงอยู่ในโซน Bearish
- ทองแดงยังคงเคลื่อนไหวในแนวโน้ม ขาขึ้นแบบ Consolidation โดยราคายังคงยืนเหนือระดับราคาหลัก 5 หลักในตลาด LME มาเกือบ 1 ปีแล้ว
- ในช่วงที่ผ่านมา ราคายังไม่สามารถทะลุ จุดสูงสุดตลอดกาล (All-Time High) ได้ ขณะที่การปรับฐานล่าสุดยังคงยืนอยู่บริเวณ Fibonacci Retracement 23.6% ของรอบการปรับตัวขึ้นล่าสุด และใกล้กับเส้นค่าเฉลี่ย SMA25 ซึ่งเป็นระดับทางเทคนิคที่ตลาดกำลังจับตา
ปัจจัยพื้นฐานและบริบทตลาด
- ตลาดทองแดงยังคงเผชิญ ความไม่สมดุลของสินค้าคงคลังในแต่ละภูมิภาค และการลดลงของผลผลิตจากเหมืองสำคัญหลายแห่งอย่างต่อเนื่อง ส่งผลให้โครงสร้างตลาดยังคงตึงตัว
- สินค้าคงคลังยังถูกส่งไปยัง สหรัฐฯ มากขึ้น จากความกังวลเกี่ยวกับการเรียกเก็บภาษีนำเข้าครั้งใหม่ ประกอบกับบทบาทของทองแดงที่เพิ่มขึ้นในเทคโนโลยีเกิดใหม่
- สมดุลระหว่างอุปสงค์และอุปทานในตลาดโลกยังสะท้อน ภาวะขาดแคลนการขนส่งทองแดงทางกายภาพ ส่งผลให้ Premium ในแต่ละภูมิภาคปรับตัวสูงขึ้น
- อย่างไรก็ตาม อุปสงค์จากภาคก่อสร้างและอุตสาหกรรมในเศรษฐกิจหลักของเอเชียยังเป็นปัจจัยจำกัดการปรับตัวขึ้นของทองแดง โดย China Credit Impulse บ่งชี้ว่าการปรับตัวขึ้นของราคาทองแดงไม่ได้เกิดจากปัจจัยด้านอุปสงค์เป็นหลัก
- ตัวชี้วัดจาก Forward Curve ของทองแดง ซึ่งสะท้อนความสัมพันธ์ระหว่างสัญญาในกรอบเวลารายปี มีค่า Z-score อยู่ที่ 1.32 ในกรอบ 1 ปี, 1.72 ในกรอบ 2 ปี และ 2.63 ในกรอบ 5 ปี
- กิจกรรมการหลอมทองแดงในโรงกลั่นกำลังเผชิญข้อจำกัดด้านวัตถุดิบจากปริมาณ Copper Concentrate ที่มีจำกัด ส่งผลให้ค่าธรรมเนียมการหลอมและกลั่น (TC/RCs) อยู่ในระดับต่ำ
- Sentiment ของตลาดที่วัดผ่านตัวชี้วัดเชิงสังเคราะห์ยังอยู่ในระดับ เป็นกลาง สะท้อนแรงต่อสู้ระหว่างปัจจัยพื้นฐานด้านอุปทานที่แข็งแกร่ง กับความกังวลเกี่ยวกับภาวะการผลิตในภาคอุตสาหกรรมทั่วโลก
- ความกังวลเกี่ยวกับการหยุดชะงักของการผลิตจากเหมืองบางแห่งใน ชิลี เพิ่มขึ้น ทั้งจากการประท้วงและกรณีคนงานเสียชีวิตที่เหมือง Escondida ส่งผลให้ราคาทองแดงยังคงเคลื่อนไหวใกล้ระดับสูงสุดเป็นประวัติการณ์
- การลดลงของสินค้าคงคลังทองแดงทั่วโลกเริ่มชะลอลง ขณะที่การเพิ่มขึ้นของสินค้าคงคลังในช่วงปลายปี 2025 ถึงต้นปี 2026 มีสาเหตุหลักจากการสะสมสินค้าคงคลังใน สหรัฐฯ ส่วนในจีนยังคงเห็นการระบายสินค้าคงคลังอย่างต่อเนื่องจนแตะระดับต่ำมาก
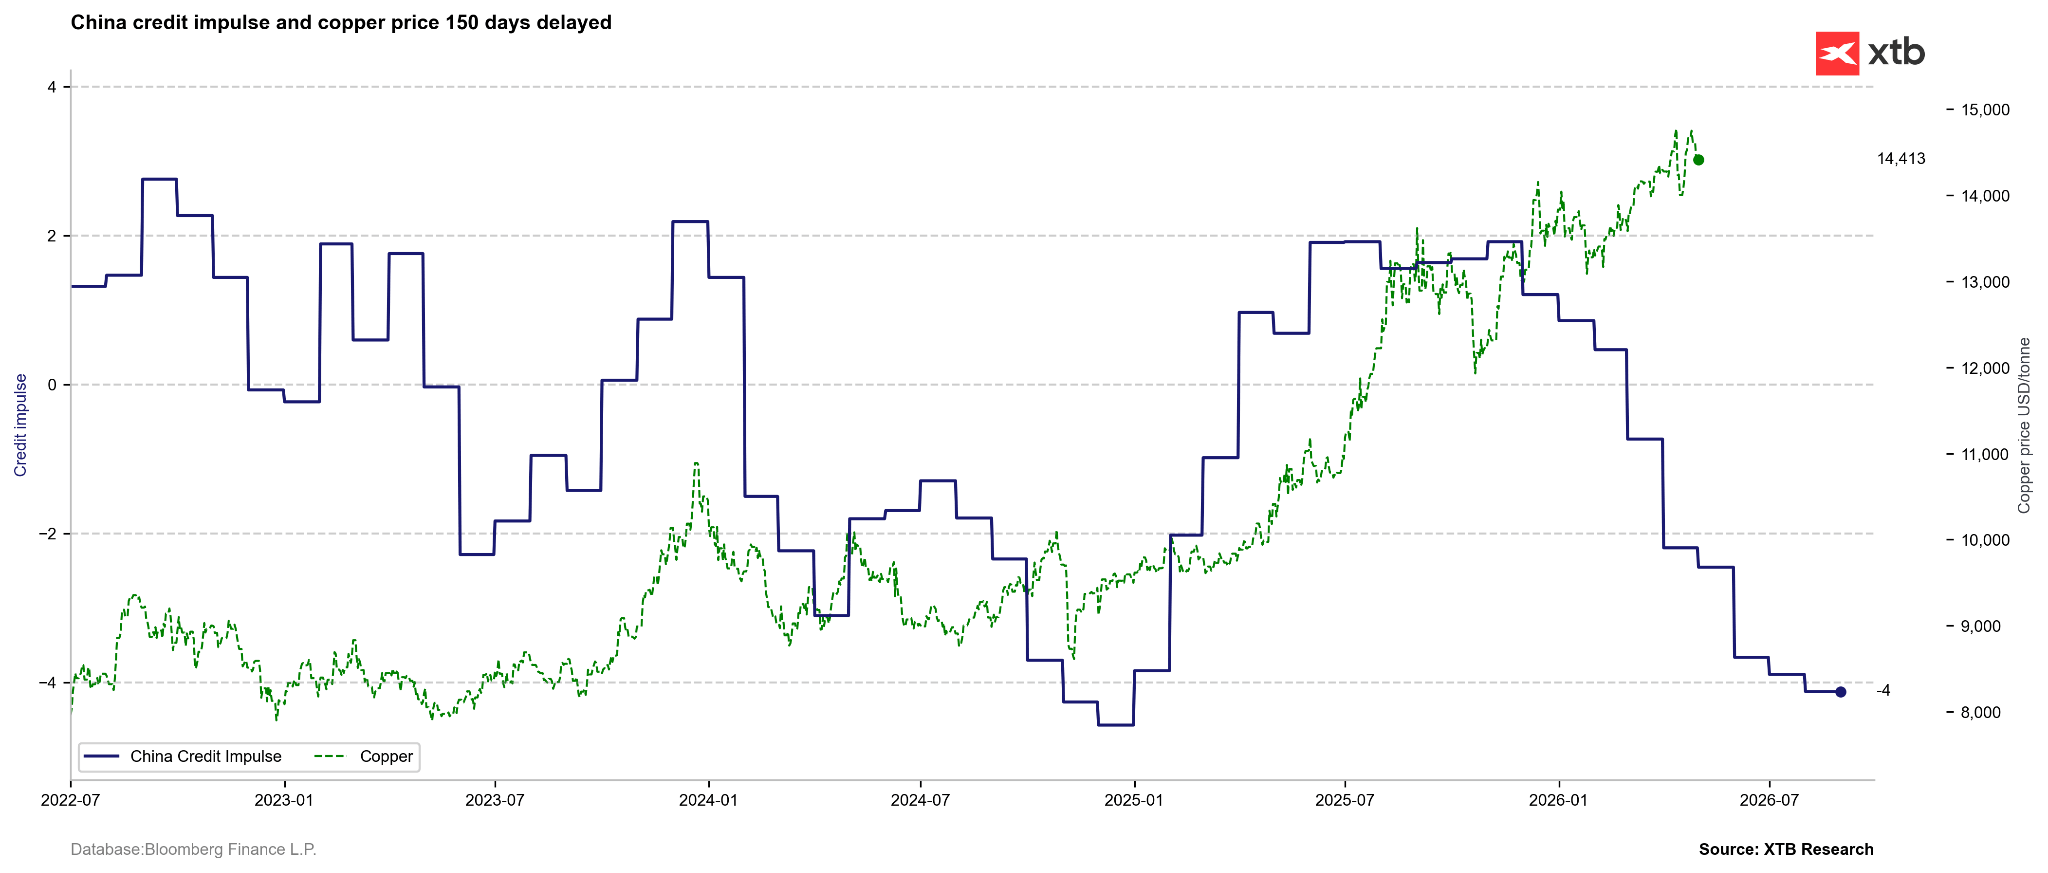
China Credit Impulse ซึ่งโดยปกติทำหน้าที่เป็นตัวชี้วัดชั้นนำของเศรษฐกิจ ปัจจุบันสะท้อนว่าการปรับตัวขึ้นของราคาทองแดง ไม่ได้สอดคล้องกับปัจจัยด้านอุปสงค์
ที่มา: Bloomberg Finance LP, XTB
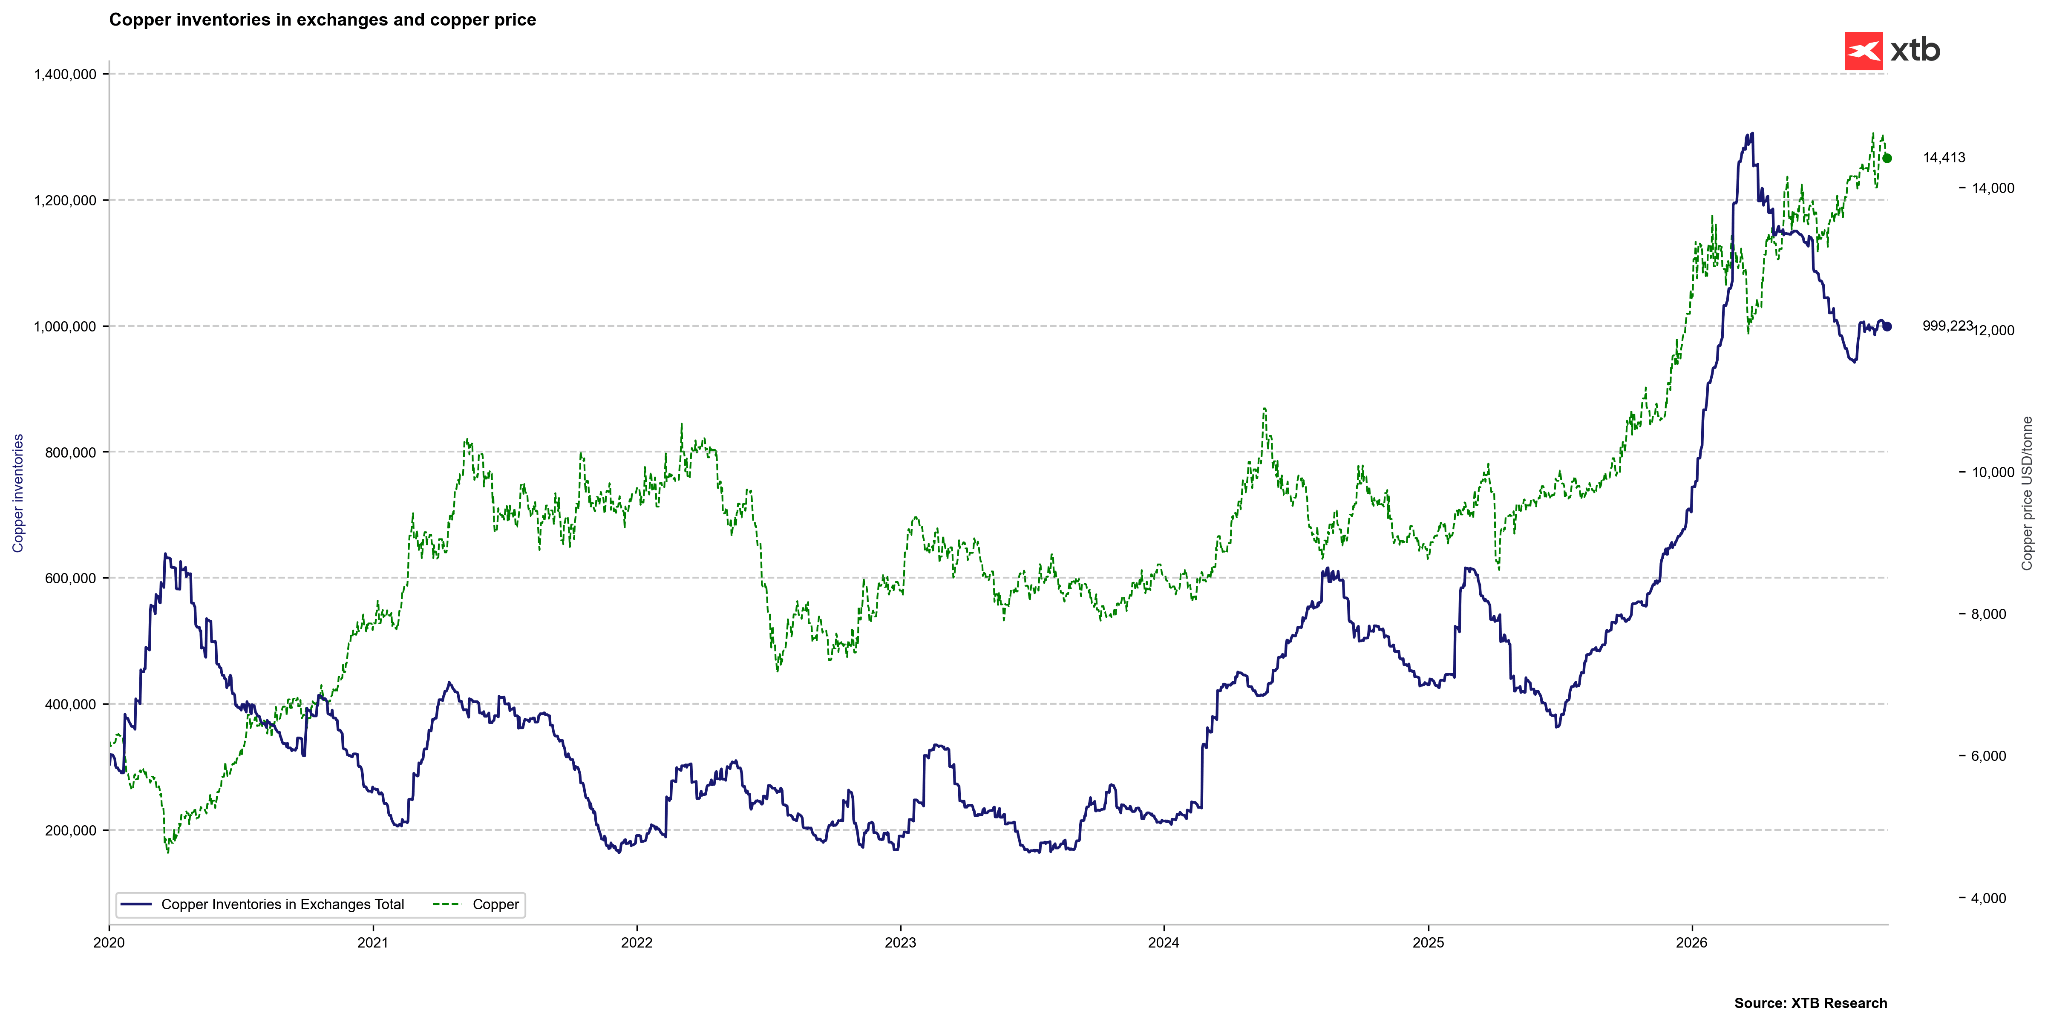
สินค้าคงคลังทองแดงในตลาดซื้อขายแลกเปลี่ยนทั่วโลก หยุดปรับตัวลดลงในช่วงที่ผ่านมา และเริ่มทรงตัวในระดับปัจจุบัน
ที่มา: Bloomberg Finance LP, XTB
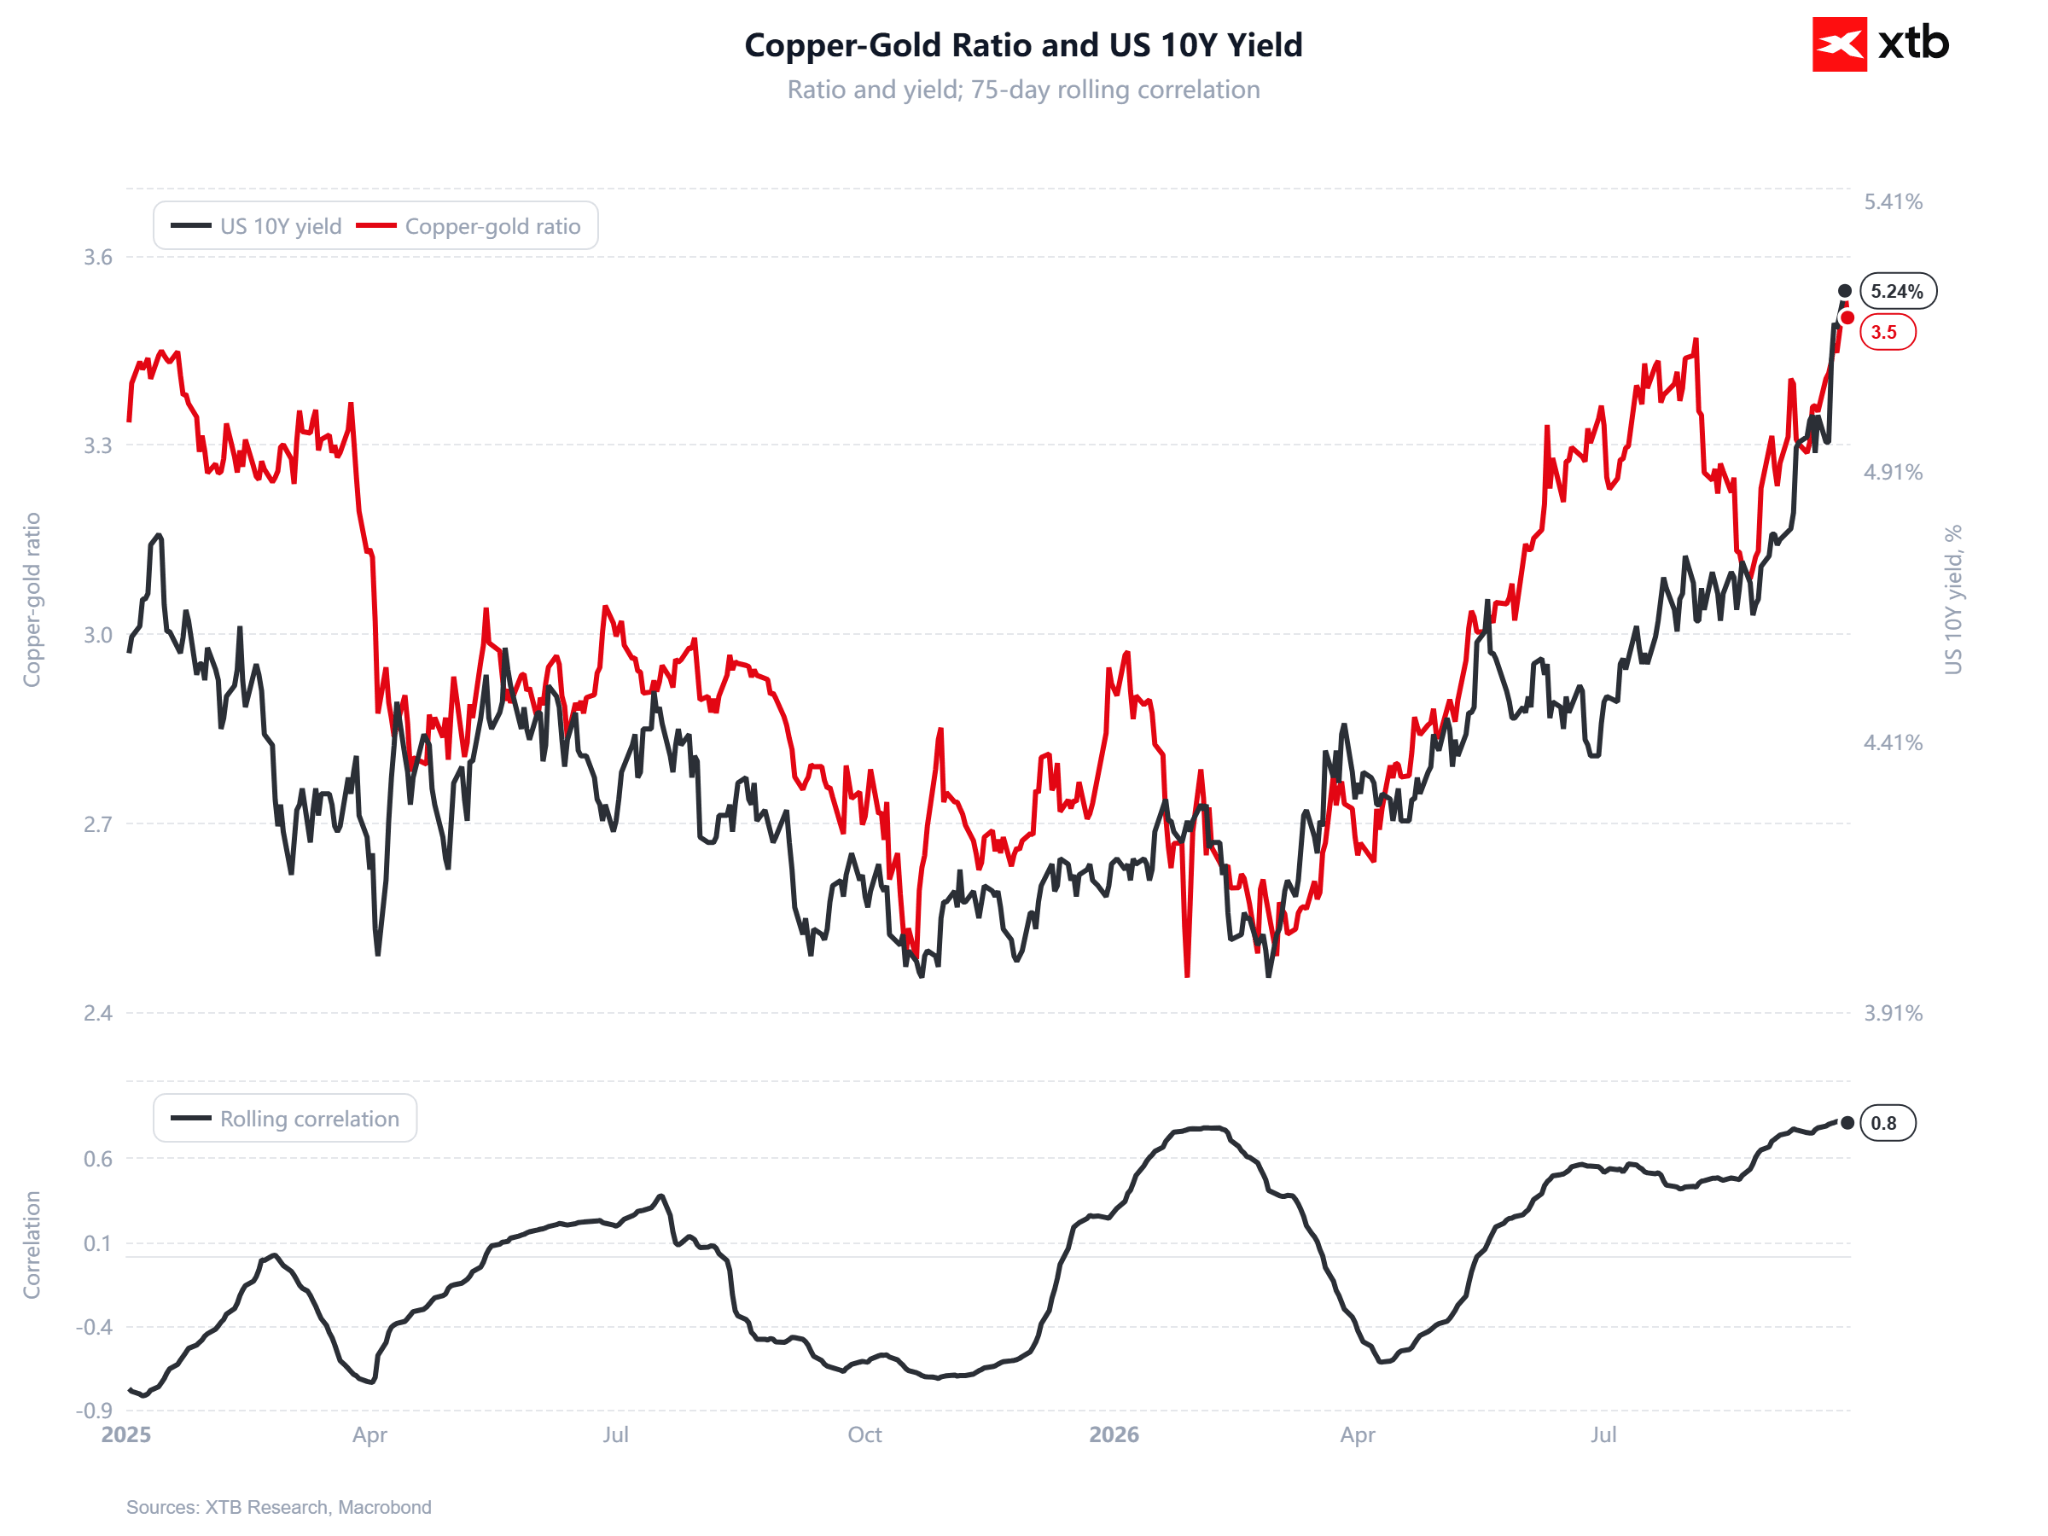
อัตราส่วน ทองแดงต่อทองคำ (Copper-to-Gold Ratio) เคยเป็นหนึ่งในตัวชี้วัดทางเศรษฐกิจที่สำคัญสำหรับประเมินทิศทางของอัตราผลตอบแทนพันธบัตร แต่ในปัจจุบัน การปรับตัวขึ้นของราคาทองแดงมีปัจจัยหลักมาจาก อุปทานที่ตึงตัวในระยะสั้น รวมถึงความกังวลในระยะยาวว่าอุปทานอาจไม่เพียงพอต่อความต้องการที่เพิ่มขึ้น อย่างไรก็ตาม ในช่วงที่ผ่านมา Copper-to-Gold Ratio ยังคงสะท้อนการปรับตัวขึ้นของอัตราผลตอบแทนพันธบัตรได้ค่อนข้างดี
ที่มา: XTB
มูลค่าในอดีต (Z-score) และสถานะการลงทุนของ CFTC
- ค่า Z-score ของราคาทองแดง อยู่ที่ 1.32 ในกรอบเวลา 1 ปี (Z1Y), 1.72 ในกรอบเวลา 2 ปี (Z2Y) และเพิ่มขึ้นเป็น 2.63 ในกรอบเวลา 5 ปี (Z5Y)
- ค่า Z-score ในกรอบ 5 ปีมีความผันผวนอย่างเห็นได้ชัดในช่วงหลายเดือนที่ผ่านมา โดยอยู่ที่ 2.17 เมื่อ 6 เดือนก่อน, เพิ่มขึ้นเป็น 2.62 เมื่อ 3 เดือนก่อน, ขยับขึ้นเล็กน้อยเป็น 2.79 เมื่อ 1 เดือนก่อน และล่าสุดทรงตัวที่ 2.63
- ข้อมูล CFTC ณ วันที่ 22 กันยายน 2026 ระบุว่า สถานะสุทธิของกองทุนเก็งกำไรอยู่ที่ 90,522 สัญญา Long โดย Position Z-score แตะระดับสูงถึง +2.12 ซึ่งสอดคล้องกับ Percentile 99.9% เมื่อเทียบกับข้อมูลในอดีต
- สถานะการลงทุนเพิ่มขึ้นอย่างมากในรอบสัปดาห์ โดยมีเงินทุนเก็งกำไรไหลเข้าสู่ตลาดเพิ่มขึ้น 15,388 สัญญา ส่งผลให้สัดส่วนสถานะ Long เพิ่มขึ้นเป็น 76.9%
- ควรระบุว่า ข้อมูล CFTC ดังกล่าวเป็นข้อมูลของ ทองแดงสหรัฐฯ ซึ่งซื้อขายในหน่วยเซนต์ต่อปอนด์ ขณะที่ข้อมูลสถานะการลงทุนของสหรัฐฯ มีความสัมพันธ์กับราคาทองแดงในลอนดอนค่อนข้างดี และปัจจุบันยังไม่พบส่วนต่างของราคา (Spread) ระหว่างตลาดทั้งสองอย่างมีนัยสำคัญ
- เมื่อนำข้อมูลทั้งหมดมาพิจารณาร่วมกัน จะเห็นความแตกต่างอย่างชัดเจนระหว่าง มูลค่าที่ประเมินจากส่วนเบี่ยงเบนในอดีต กับ สถานะการเก็งกำไรที่อยู่ในระดับสูง โดย Percentile ที่ 99.9% และการเพิ่มขึ้นของสถานะ Net Long อย่างรวดเร็ว ประกอบกับ Sentiment ทางเทคนิคที่ยังอยู่ในระดับเป็นกลาง สะท้อนว่าตลาดมีสถานะฝั่งขาขึ้นหนาแน่นมาก
- โครงสร้างสถานะดังกล่าวเพิ่มความเสี่ยงต่อการ ขายทำกำไรอย่างฉับพลันและการปรับฐานลงอย่างรุนแรง หากเกิดปัจจัยลบจากเศรษฐกิจมหภาค หรือข้อมูลอุปสงค์ทองแดงในตลาดจริงออกมาต่ำกว่าที่คาดการณ์ไว้
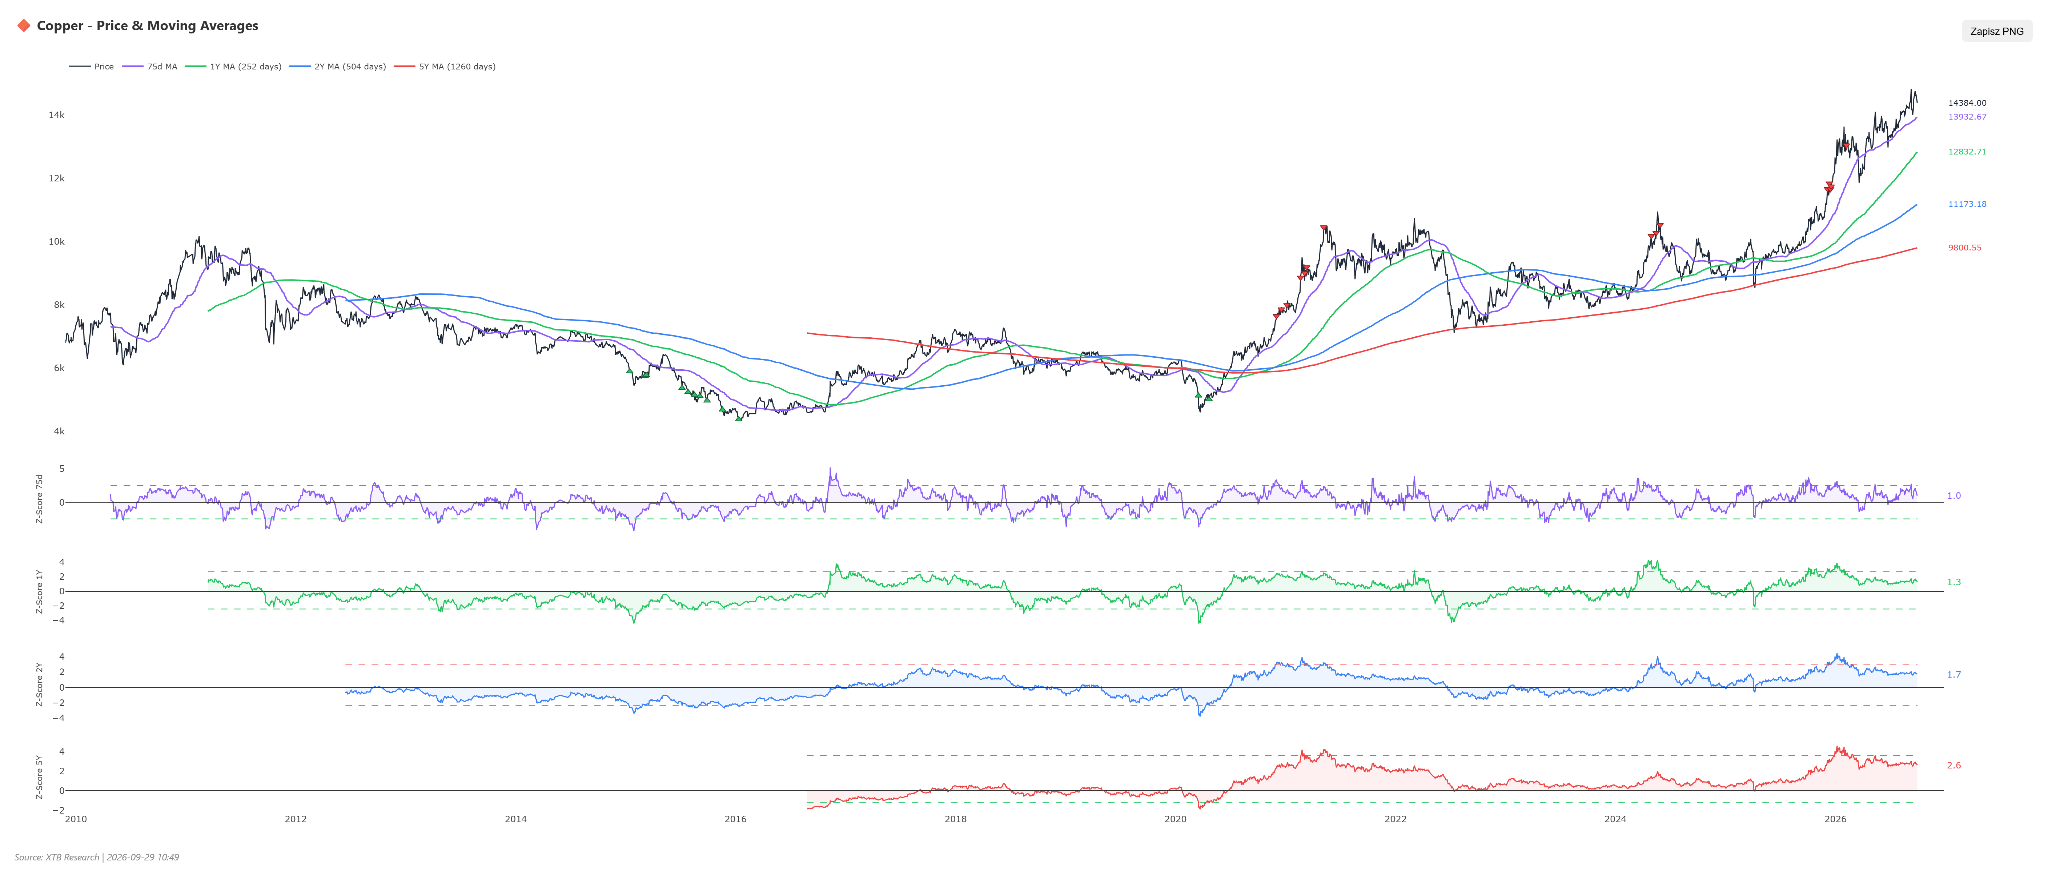 Copper remains visibly overbought looking at the 5-year average, but the previous setup in 2021-2022 suggests copper can consolidate for an extended period at high deviation levels. Source: XTB
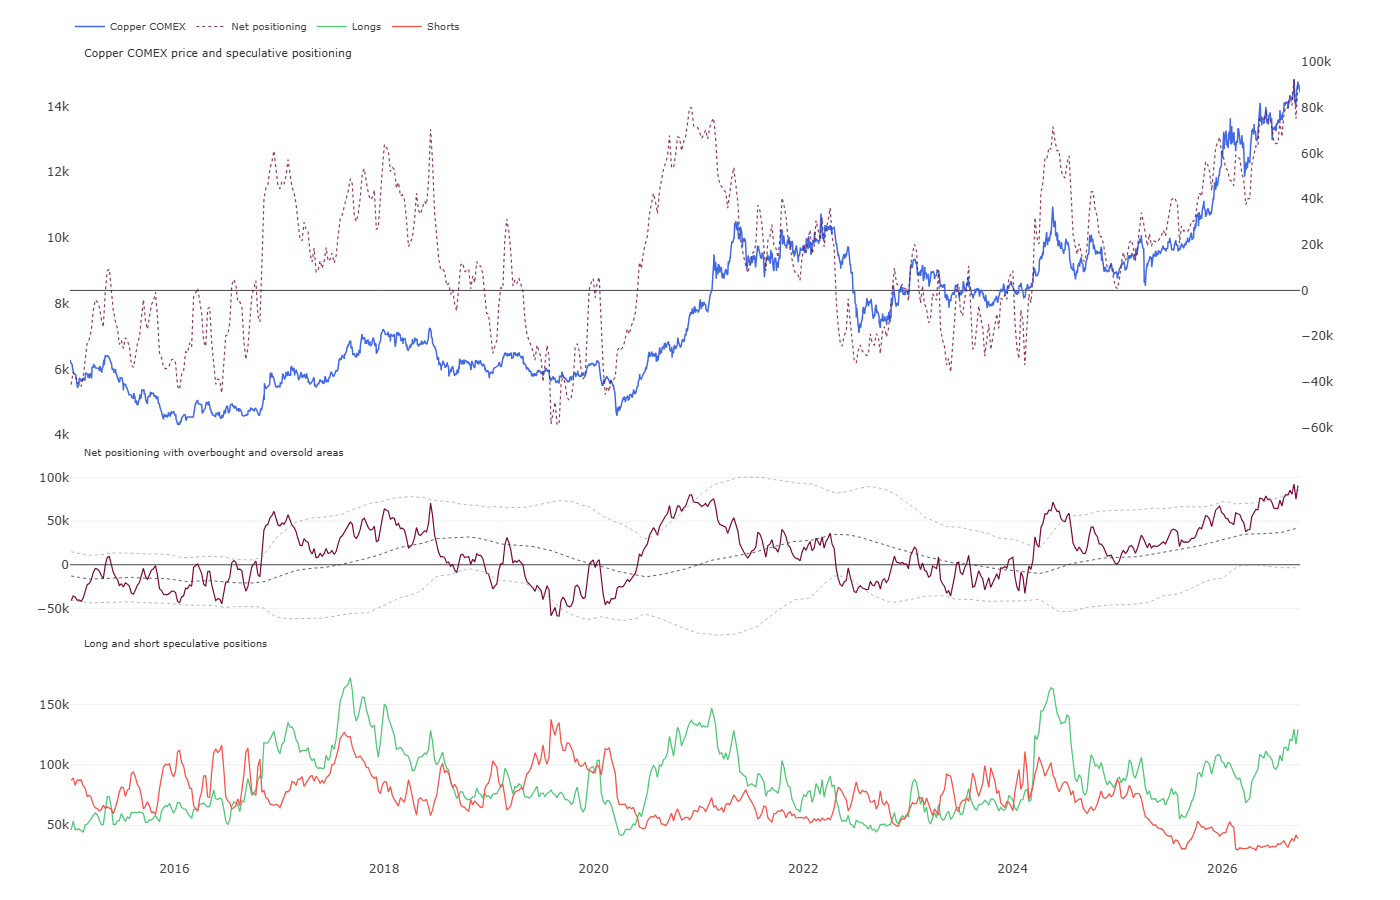 Net positions are currently near extreme overbought territory, but historically, only a clear move above a 2x standard deviation triggered a strong signal. Source: CFTC, XTB
Scenarios
- Bullish Scenario: This scenario materializes if the physical copper concentrate deficit deepens further, unexpected outages occur at key mines, and industrial activity and orders accelerate in China's high-tech and renewable energy sectors. A necessary condition is maintaining support at the SMA moving average and defending price retracement levels above USD 14,000 per ton. With strong fund backing and sustained high net positioning, copper quotes could break technical resistance and head toward USD 14,800–15,200 per ton.
- Bearish Scenario: This scenario assumes a wave of sell-offs and liquidation of extremely high long positions by speculative investors, which could be triggered by weakening macroeconomic indicators or a stronger inflow of copper scrap into developed markets. Technical conditions include a sustained RSI drop below 40, a MACD line cross in favor of sellers, and a price break below key support around USD 14,150 per ton. Under rapid liquidation of record speculative involvement, copper prices could dive toward USD 13,600–13,800 per ton.
Crude Oil
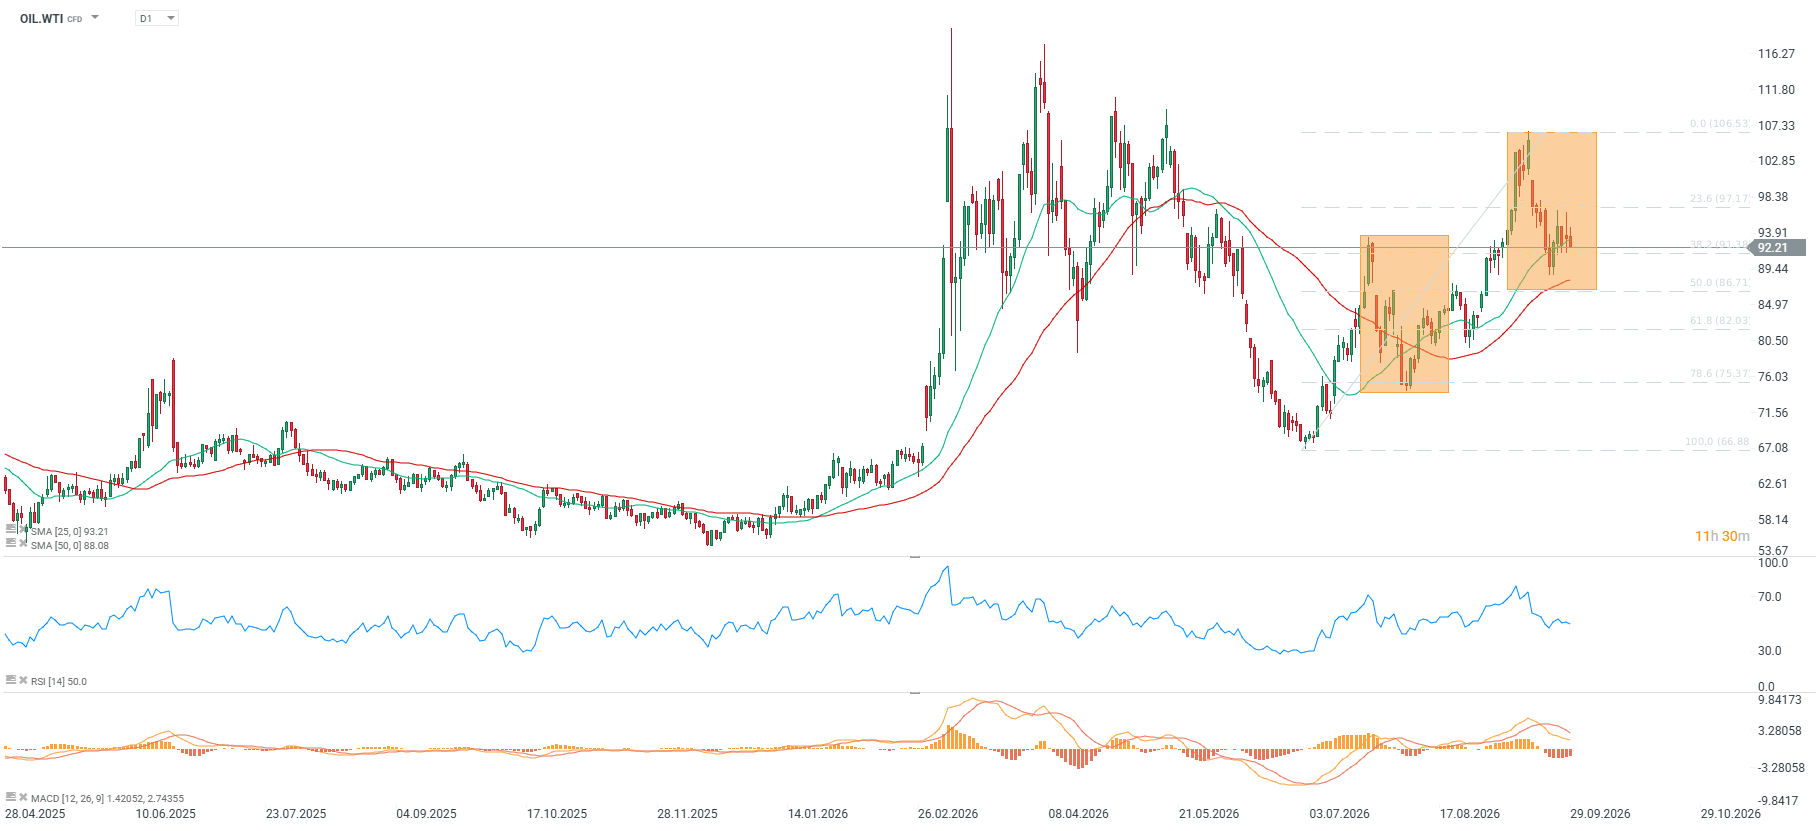
- WTI Crude is trading at USD 92.74 per barrel, reflecting a monthly gain of 7.50%, a strong YTD surge of 61.96%, and a year-on-year increase of 48.57%.
- The RSI indicator stands at 45, indicating a neutral market position; the SMA moving average maintains a bullish signal, while the MACD indicator generates a bearish signal.
- Quotes remain 5.28% above the 50-period SMA moving average under neutral market sentiment, though morning gains have given way to a pullback below the 25 SMA.
- Nevertheless, only a move below the 50.0 retracement would signal a genuine attempt to break the uptrend that has been in place since early July.
Fundamental and Market Context
- November Brent crude futures fell to USD 105 per barrel, while the December contract struggled to break back above USD 100 per barrel.
- Partial recovery of transit through the Strait of Hormuz to around 7.4 million bpd, monitored by Kpler, enabled total Middle East exports to rise to 12.8 million bpd in September. Some reports even suggest Middle East exports over recent days reached up to 17 million bpd.
- However, the key aspect is that costs associated with Persian Gulf oil exports (insurance, transshipment) currently run up to USD 20-30 per barrel. Therefore, only a genuine agreement could drive a sustained price slump below the USD 80 per barrel mark.
- The OPEC+ alliance maintained output cuts unchanged, with Saudi Arabian production stabilizing around 10.48 million bpd.
- The International Energy Agency (IEA) estimates effective OPEC+ spare capacity at just 0.22 million bpd, signaling an absence of supply buffer.
- The US EIA forecasts forced production shut-ins in the Persian Gulf averaging 5.7 million bpd in Q4 2026.
- Announcements of a potential US diesel export ban caused crack margins to collapse to a monthly low, discouraging US refiners from crude purchases and weighing on WTI prices while driving up European diesel prices.
- Iran's parliamentary leader, Qalibaf, stated via state media that no country in the region will sell its oil if Iran cannot sell its own, warning that a lack of security for Iran means a lack of security for regional infrastructure.
- The European Central Bank, through representative Kazimir, highlighted that energy prices remain a key macroeconomic factor.
- Lufthansa Group pointed to oil prices and fleet issues as main factors signaling another year of operational and financial challenges for the carrier.
- Argentina threatened legal action and a lawsuit against the United Kingdom unless an offshore oil drilling project near the Falkland Islands is suspended.
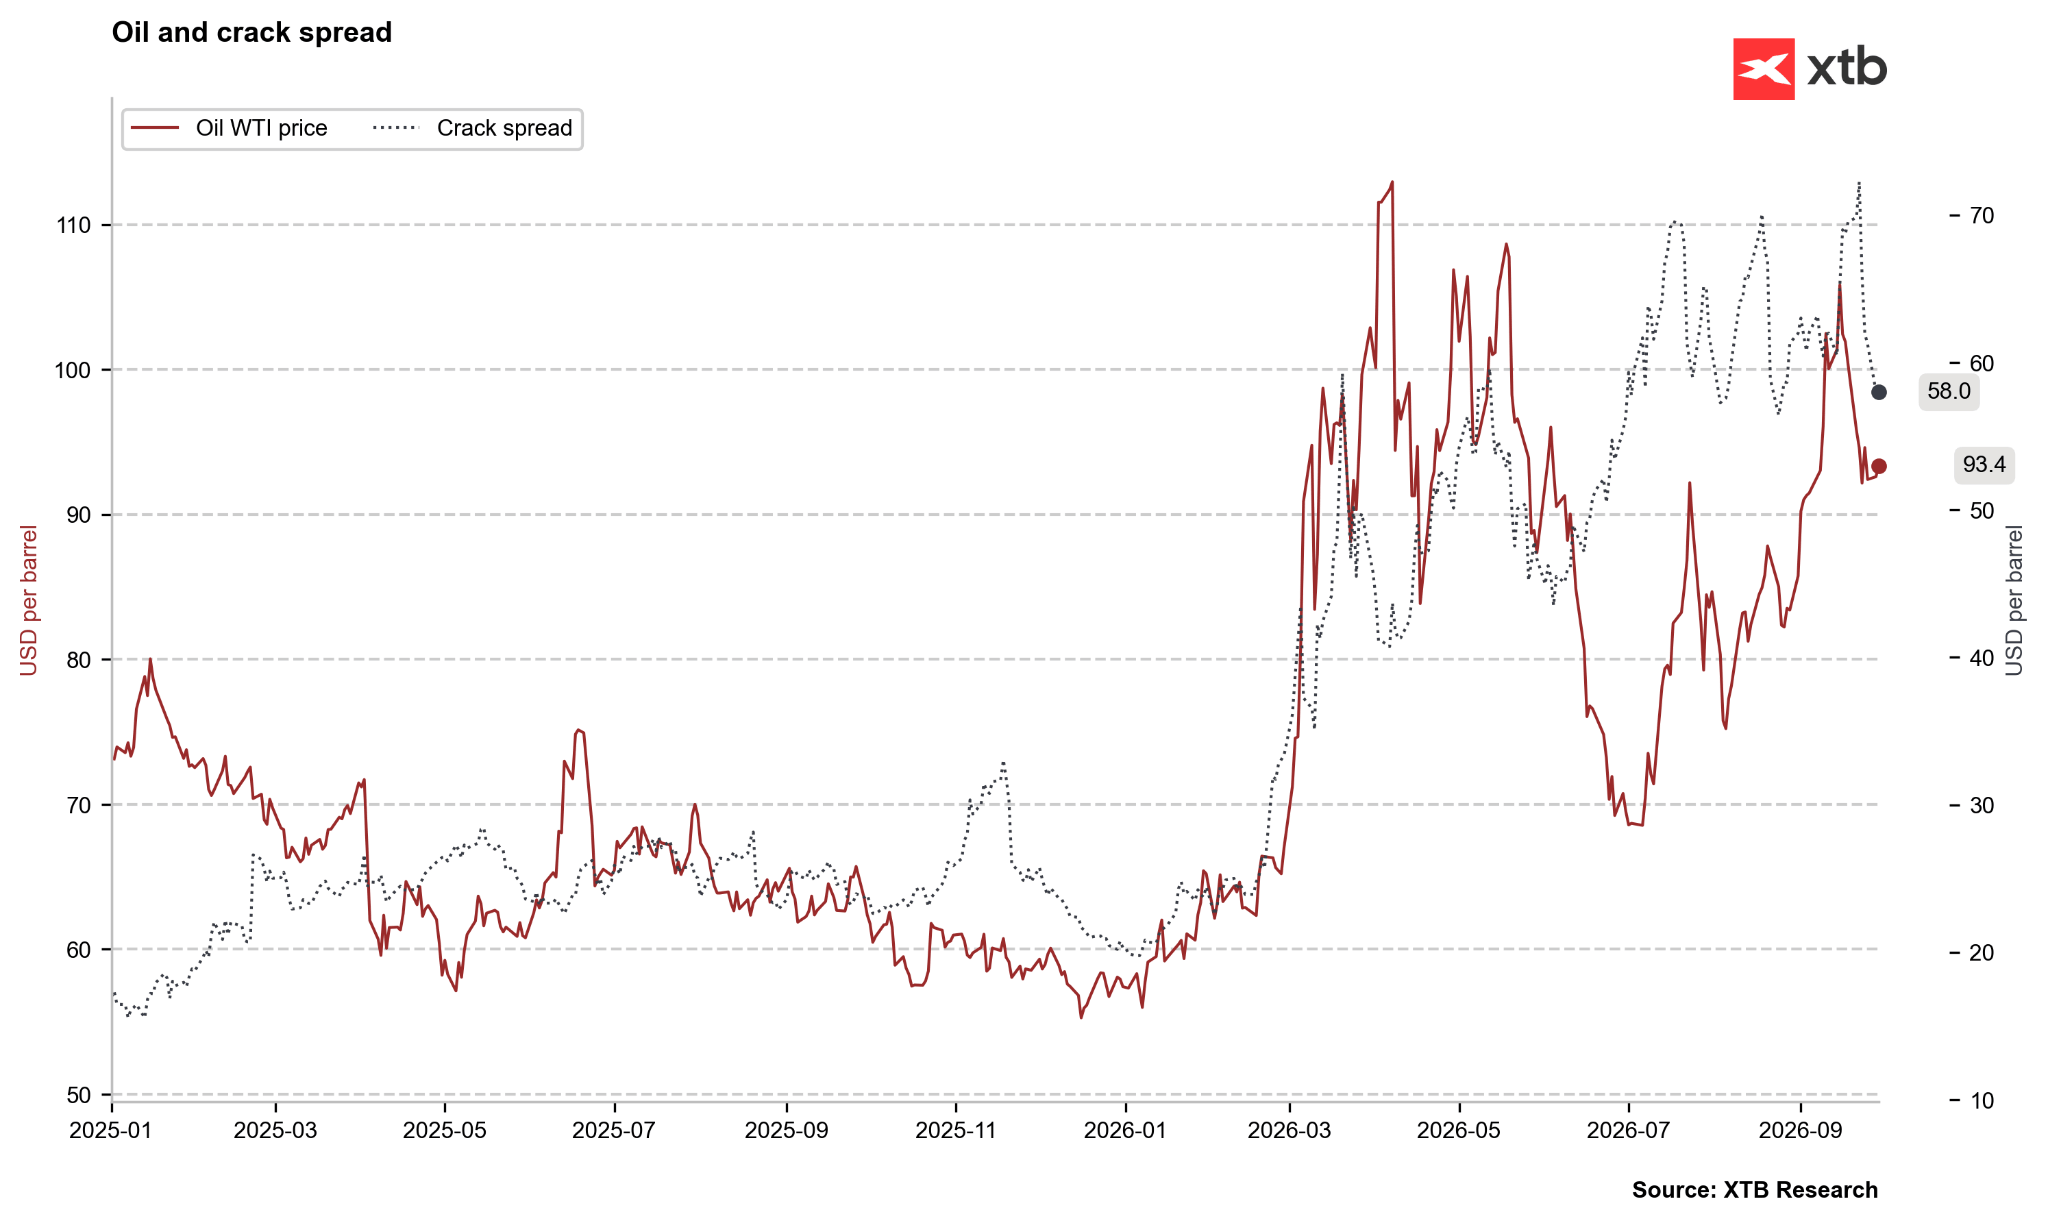 Crack spread is dropping visibly, but remains at historically high levels. Source: Bloomberg Finance LP, XTB
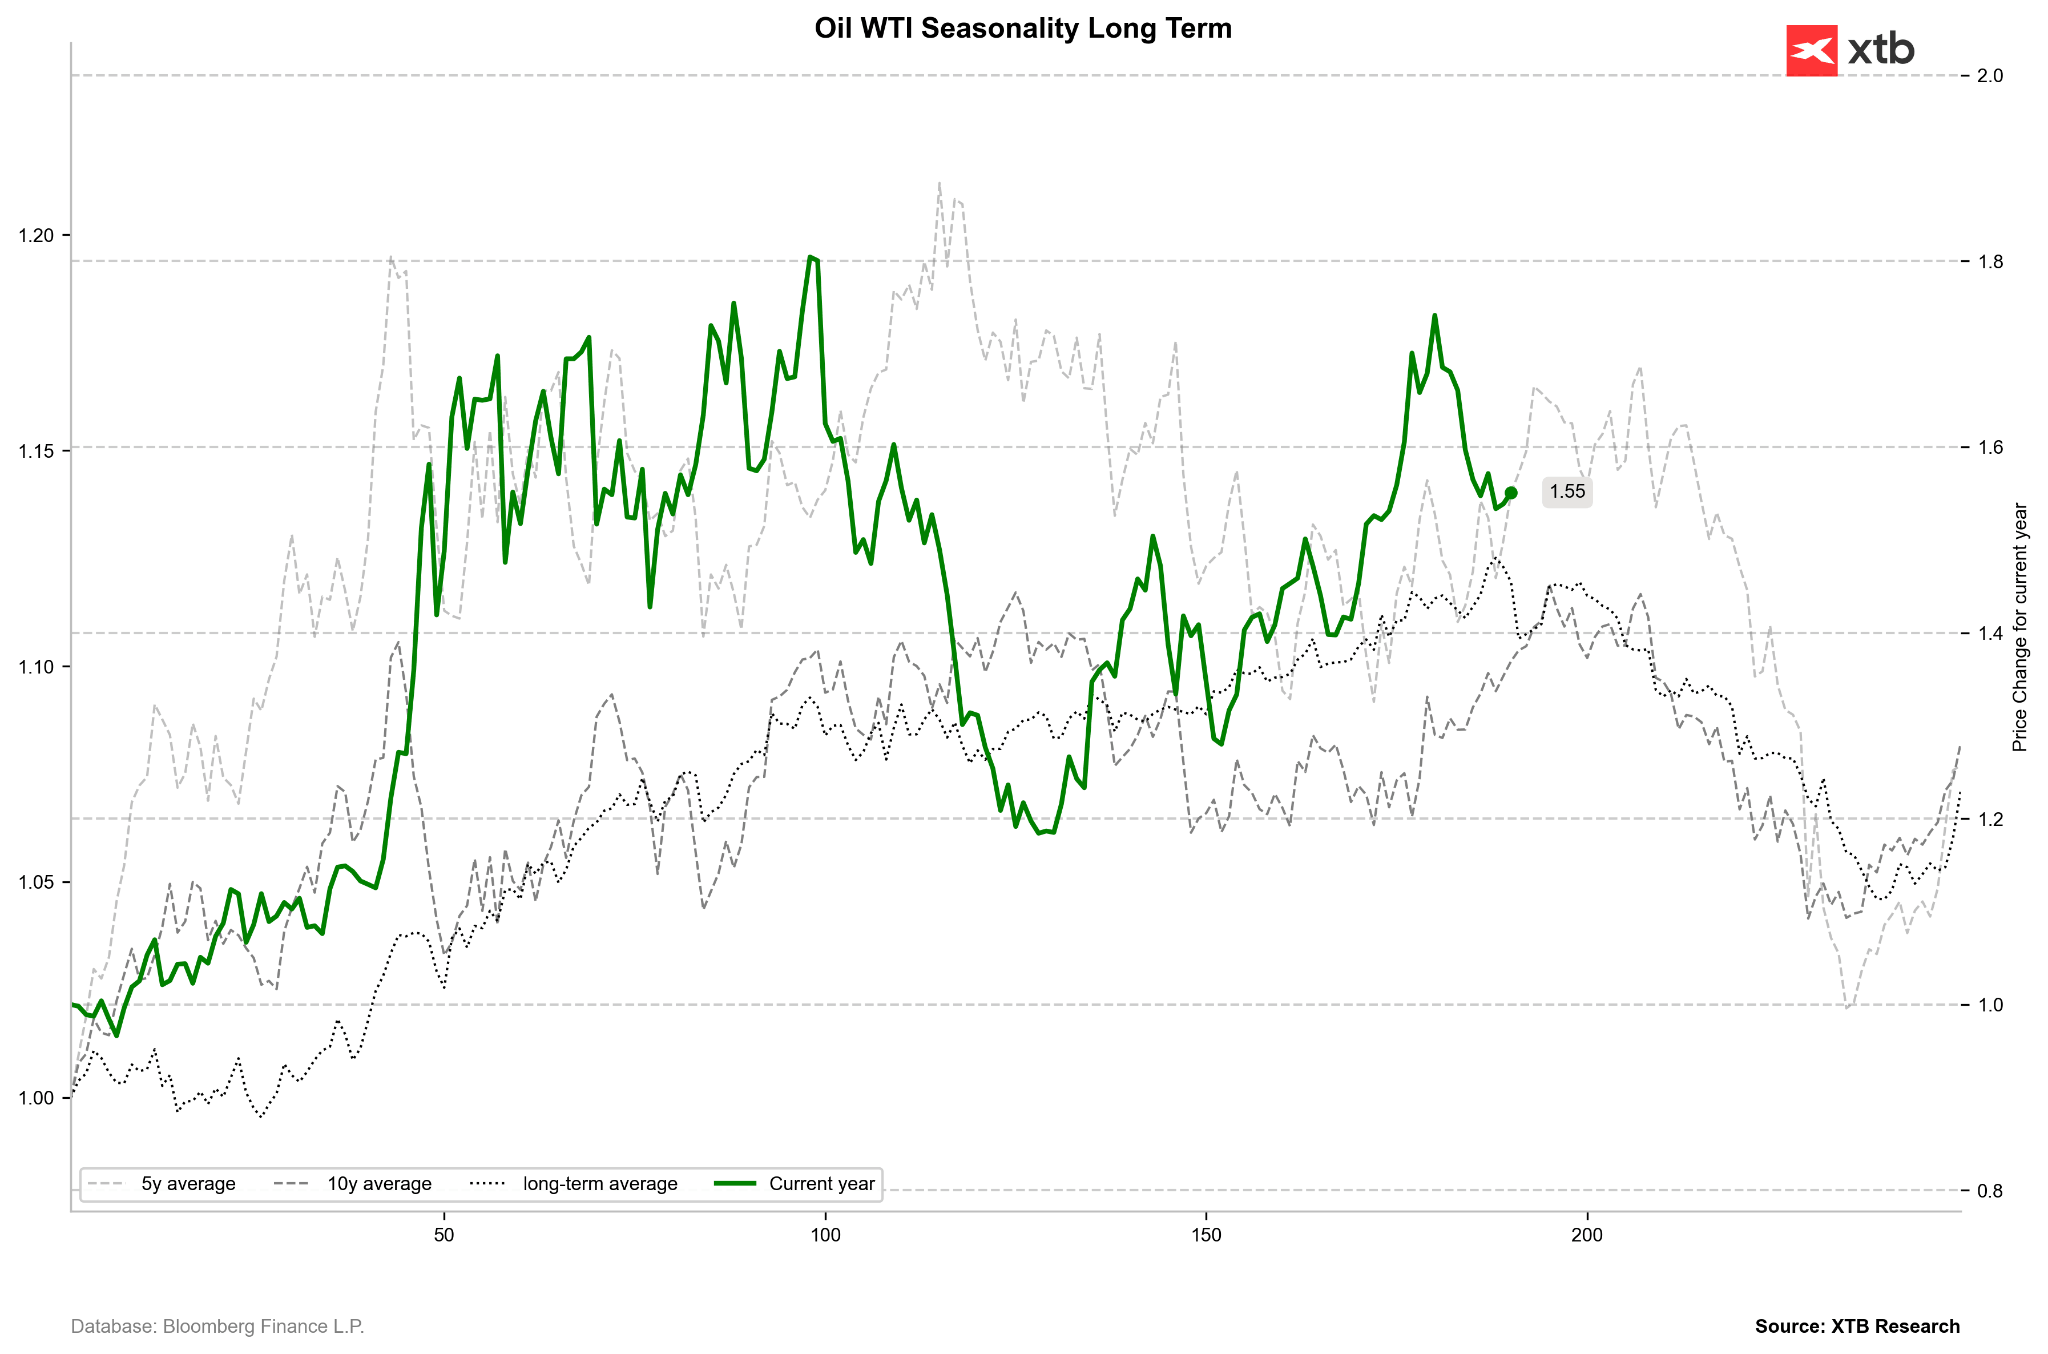 WTI Crude is approaching a seasonal peak. Long-term averages point to price pullbacks in the October-November period. Source: Bloomberg Finance LP, XTB
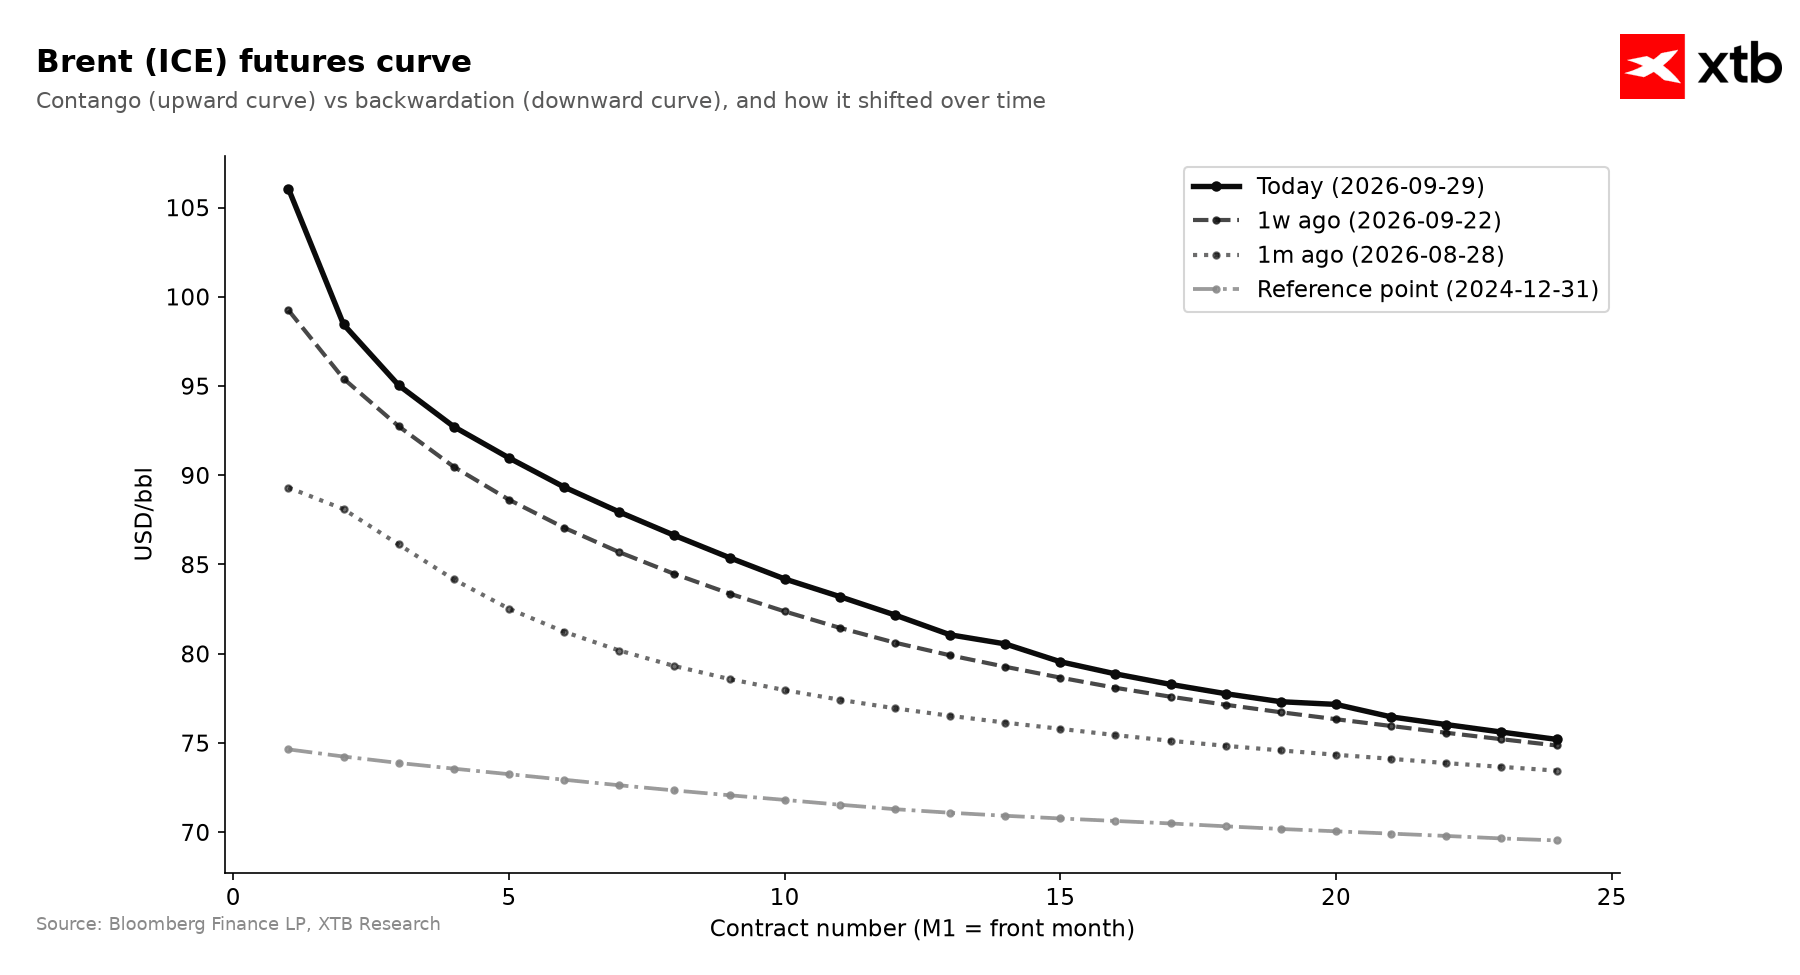 The front calendar spread on Brent is exaggerated mainly due to contract expiration. However, the entire curve is elevated, even amid signs of returning exports from the Middle East. Source: XTB
Historical Valuation (Z-score) and CFTC Positioning
- The Z-score for crude oil stands at Z1Y: +0.90, Z2Y: +1.54, and Z5Y: +1.04.
- Over a 5-year view, the Z-score showed volatility, standing at +0.37 one month ago, -0.61 three months ago, +1.26 six months ago, and currently stabilizing at +1.04, reflecting a clear rebound in medium-term valuations.
- According to CFTC data as of September 22, 2026, net speculative positioning reached +141,106 contracts, with a Z-score of -0.18 and a percentile of 58.1%.
- The weekly net position change showed an increase of 5,201 contracts, with the long position share settling at 62.2%.
- Speculative positioning sits within moderate historical bounds and shows no extreme swings, confirming moderate market optimism without signs of an exaggerated speculative bubble.
- This means current valuation relies more heavily on solid fundamental and geopolitical drivers than on escalating financial leverage from speculators.
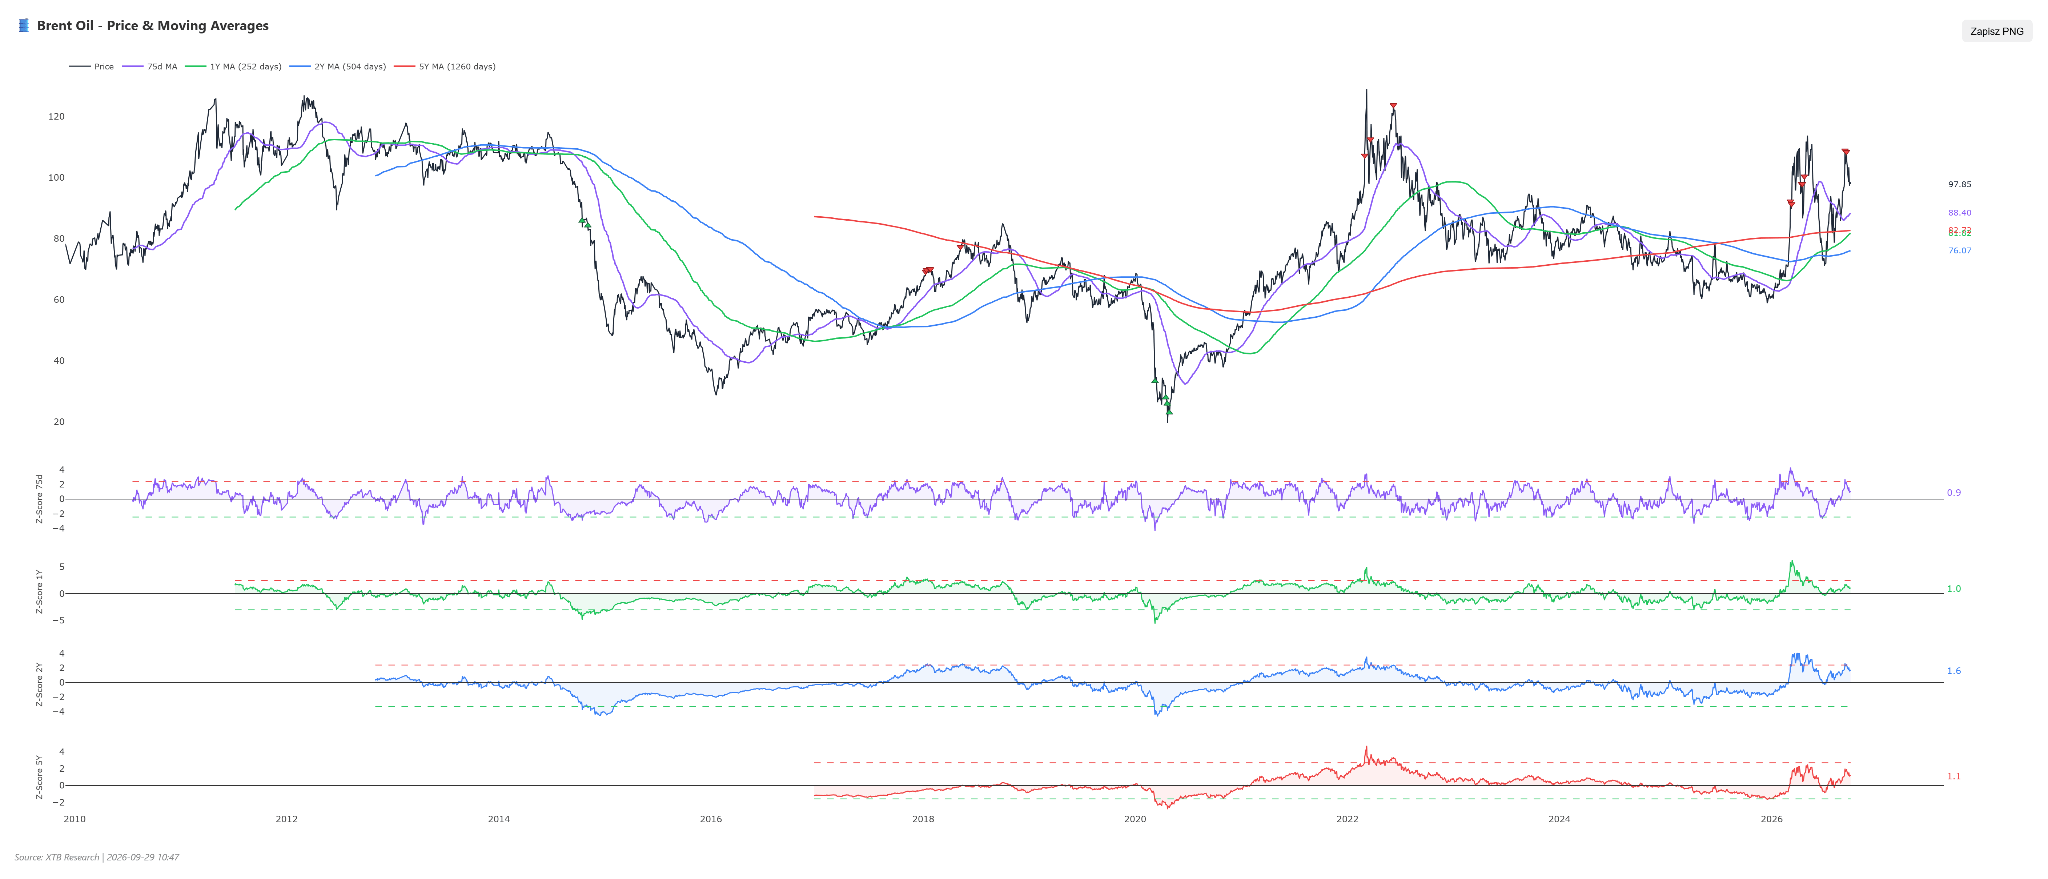 Oil recently showed a short-term overbought signal relative to the 3-month and 2-year moving averages. Source: XTB
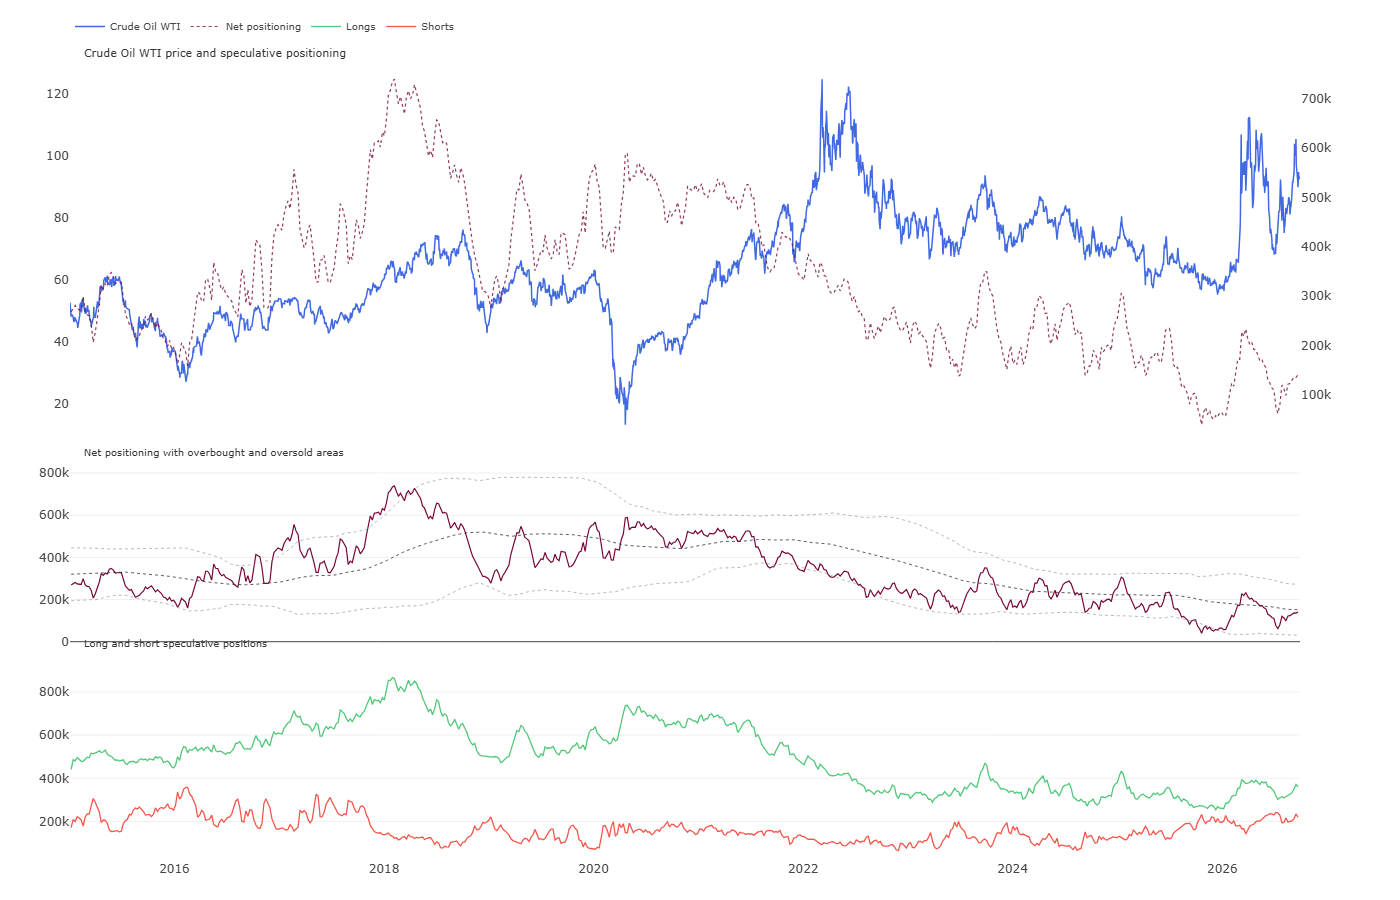
Recently, we observed a slight increase in long positions, bringing net positions near the 2-year average. A long position increase above 400,000 could provide a mild contrarian overvaluation signal. Source: CFTC, XTB
Scenarios
- Bullish Scenario: The bullish scenario assumes the materialization of geopolitical risk through a sustained blockade of maritime routes in the Middle East or further escalation of tensions in the Persian Gulf region, which, given critically low OPEC+ spare production capacity of 0.22 million bpd, will trigger a sharp physical deficit. An additional bullish catalyst will be maintaining a wide spread between Brent and WTI along with a deepening product crisis in Europe linked to North American fuel export restrictions. These conditions must lead to breaking technical resistance, targeting Brent crude quotes above USD 110.00 per barrel and US WTI crude toward USD 98.00–100.00 per barrel.
- Bearish Scenario: The bearish scenario assumes an easing of geopolitical tensions in the Strait of Hormuz and a full, stable normalization of maritime transit above projected levels, accompanied by declining refining margins and the actual implementation of US diesel export curbs hitting base demand in America. Bearish pressure will also be reinforced by scheduled refinery downtime and waning inflationary pressure forcing more restrictive central bank actions. Fulfilling these technical and fundamental conditions will pull WTI crude quotes below support around USD 88.00 per barrel, and Brent crude toward USD 90–95 per barrel.
Coffee
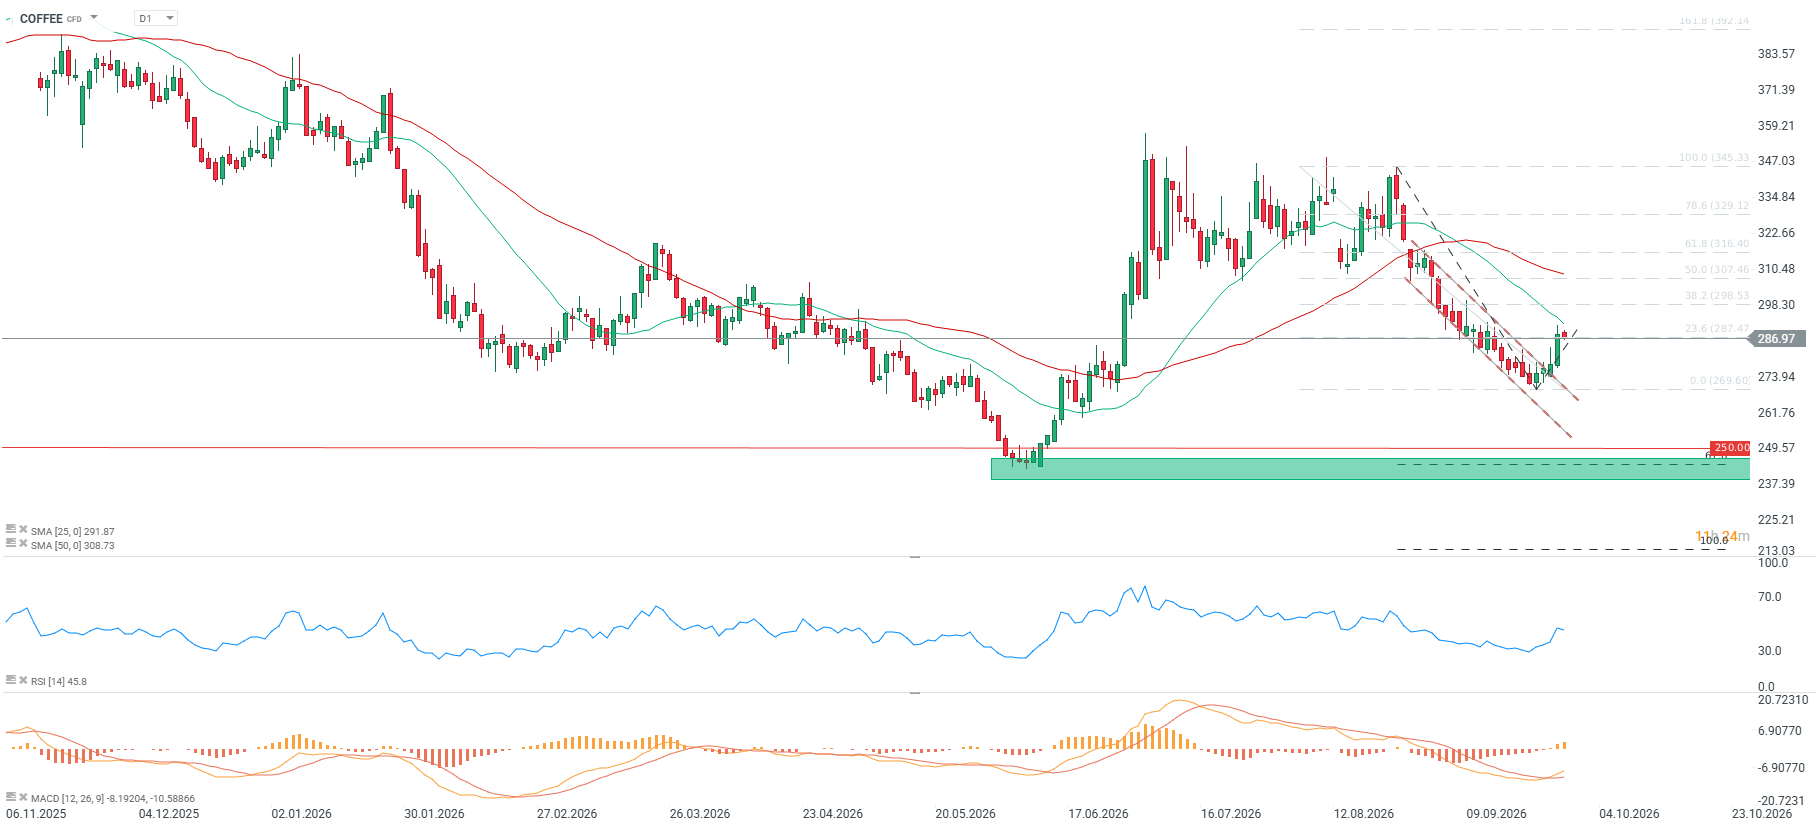
- The current coffee futures contract price stands at 289.77, recording a monthly drop of 7.23%, a year-to-date (YTD) decline of 18.41%, and a year-on-year correction of 22.55%.
- The RSI indicator sits at a neutral level of 49, while the SMA moving average generates bullish signals, further supported by a rising MACD indicator.
- Quotes remain 6.16% below the 50-session moving average under neutral market sentiment.
- A breakout from the downward trendline generates a potential bullish signal, but only a move above 300 cents per pound and above the 25 SMA would offer a chance for a sustained recovery and an attempt to reach the 50.0 retracement area of the latest downward wave.
- If coffee prices fail to climb back above 290 cents per pound, the current breakout might only represent a brief correction followed by an attempt to drop toward June lows below 250 cents per pound, where the 61.8 extension of the last corrective leg in the August-September downtrend lies.
Fundamental and Market Context
- Arabica coffee futures registered their largest monthly gain in New York, surging late in September by up to 4.6% to USD 2.915 per pound for December delivery after breaking through a key technical threshold at USD 2.84 per pound.
- Overall market fundamentals remain bearishly tilted, primarily influenced by Brazil continuing shipments of its massive current crop, expected to comfortably surpass 70 million bags total.
- Brazil is estimated to export between 4.3 million and 4.6 million bags of coffee in September, with the majority consisting of Arabica beans, which analysts consider a very strong volume.
- Meteorological forecasts project rainfall in Brazil over upcoming days, expected to stimulate and encourage flowering ahead of the next harvest season.
- Rainfall in Brazil's largest Arabica coffee-growing region reached 29.7 mm last week, representing 112% of the historical norm for this period.
- The southern and southwestern regions of Minas Gerais state typically account for roughly 30% of domestic Arabica production, and historical average rainfall for this time stands at 26.4 mm, within a range of 0.6 mm to 79.4 mm.
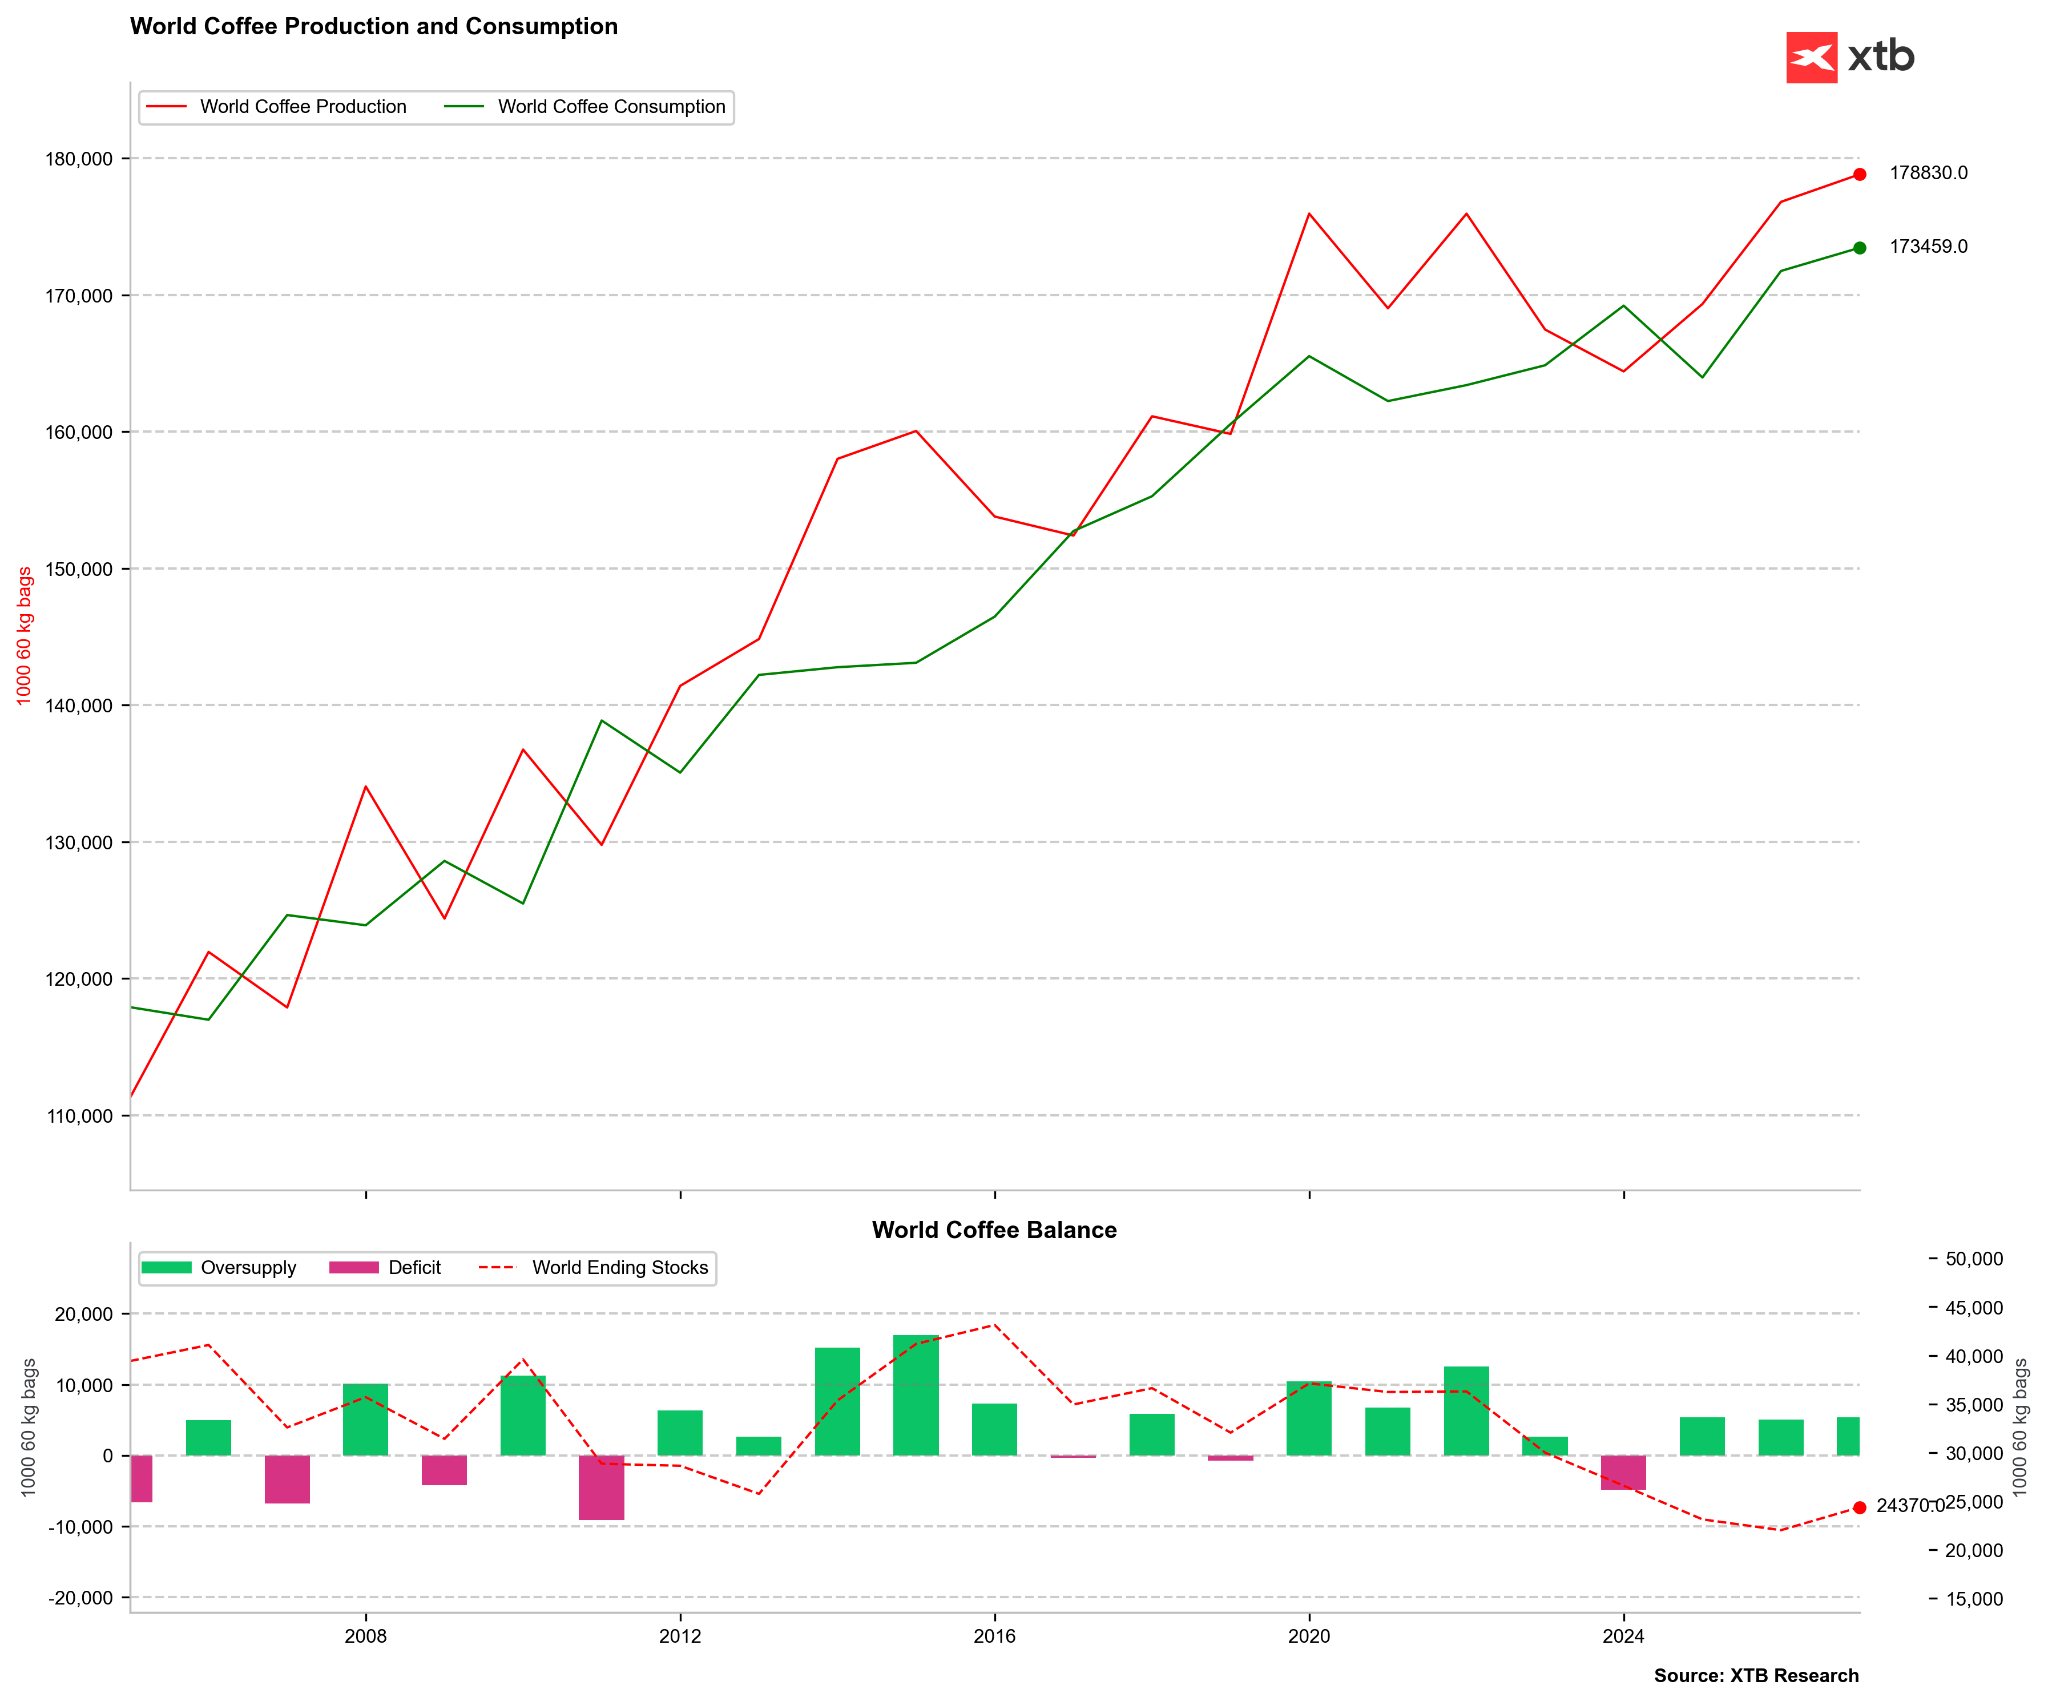 According to USDA data, the 26/27 season is set to be another year of heavy oversupply. Source: Bloomberg Finance LP, XTB
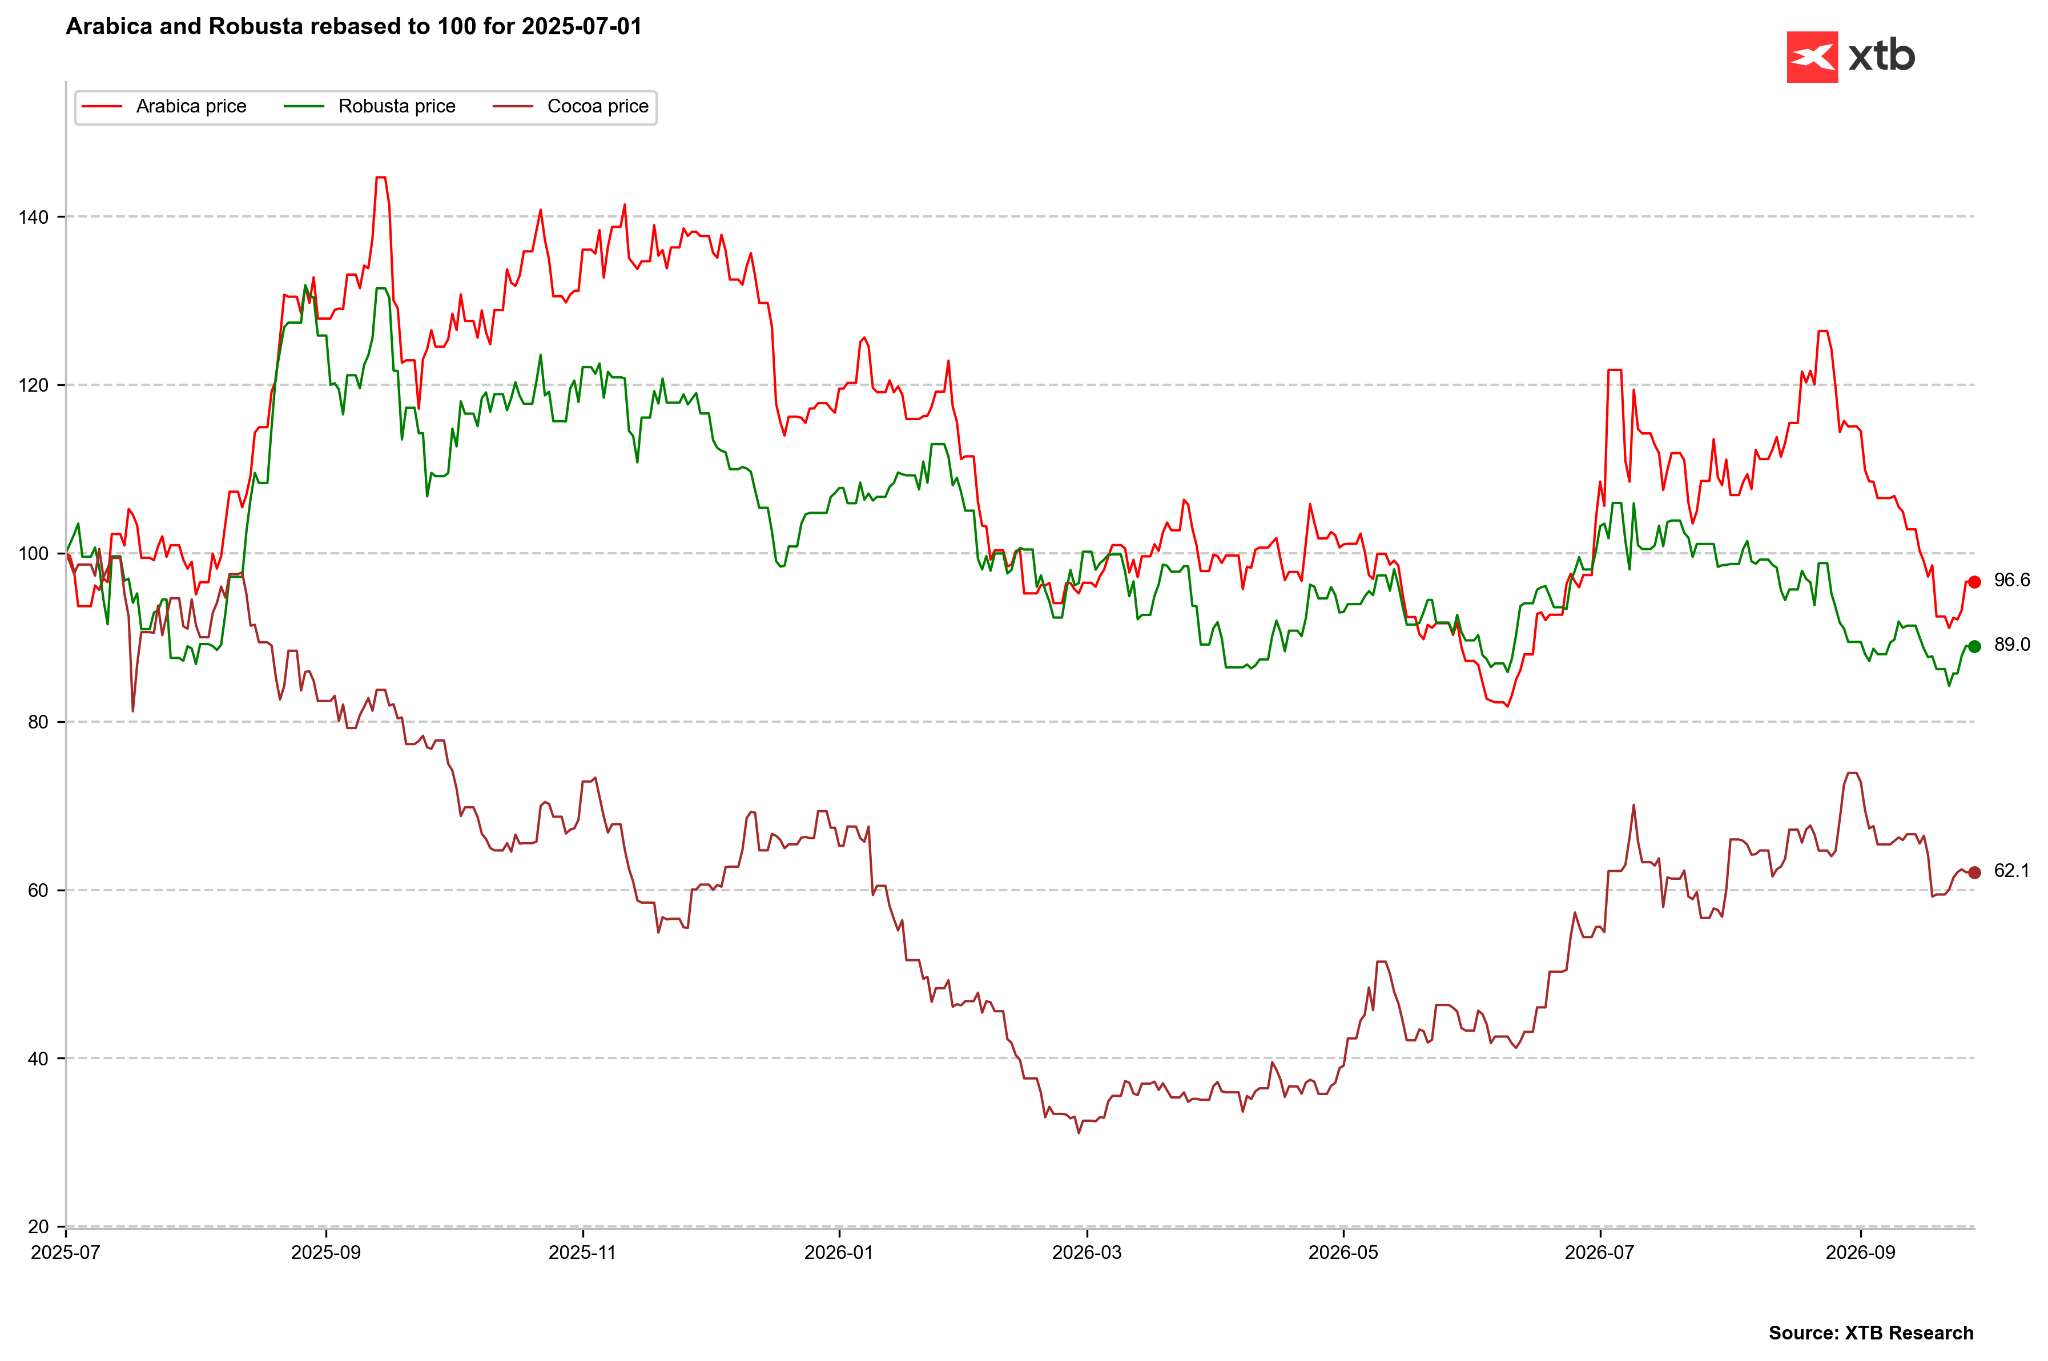 Arabica prices adjusted to match previously sharp declines in Robusta. However, it is worth remembering that Robusta could potentially face upside risks given El Niño's impact on crops in Vietnam and Indonesia. Source: Bloomberg Finance LP, XTB
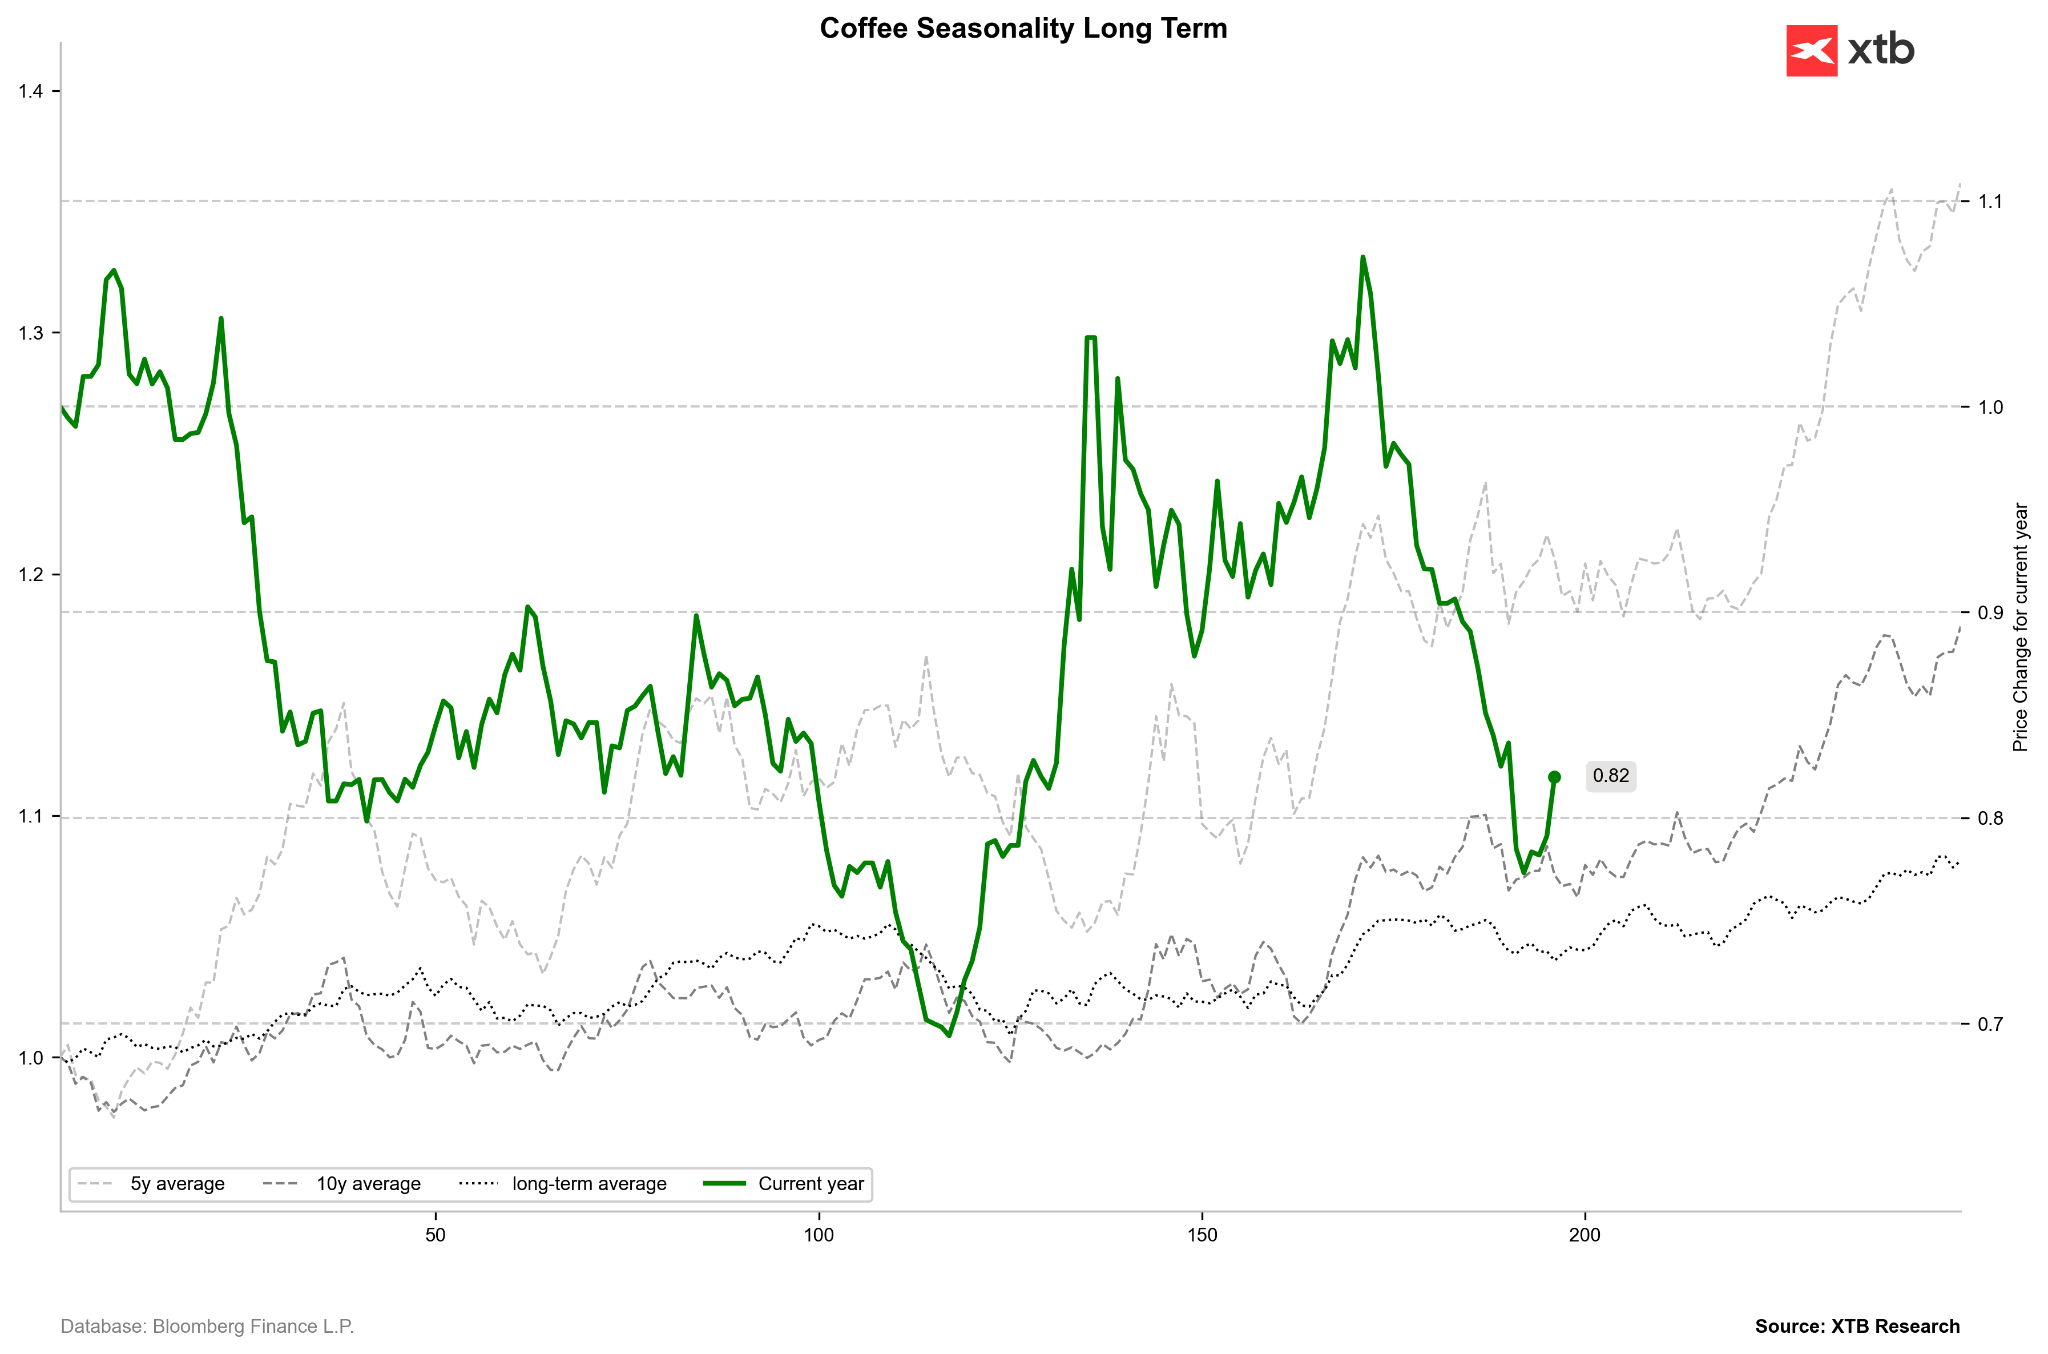 Looking at historical coffee price behavior, the very end of the year has typically been good for coffee. Seasonality shows consolidation through late November. Source: Bloomberg Finance LP, XTB
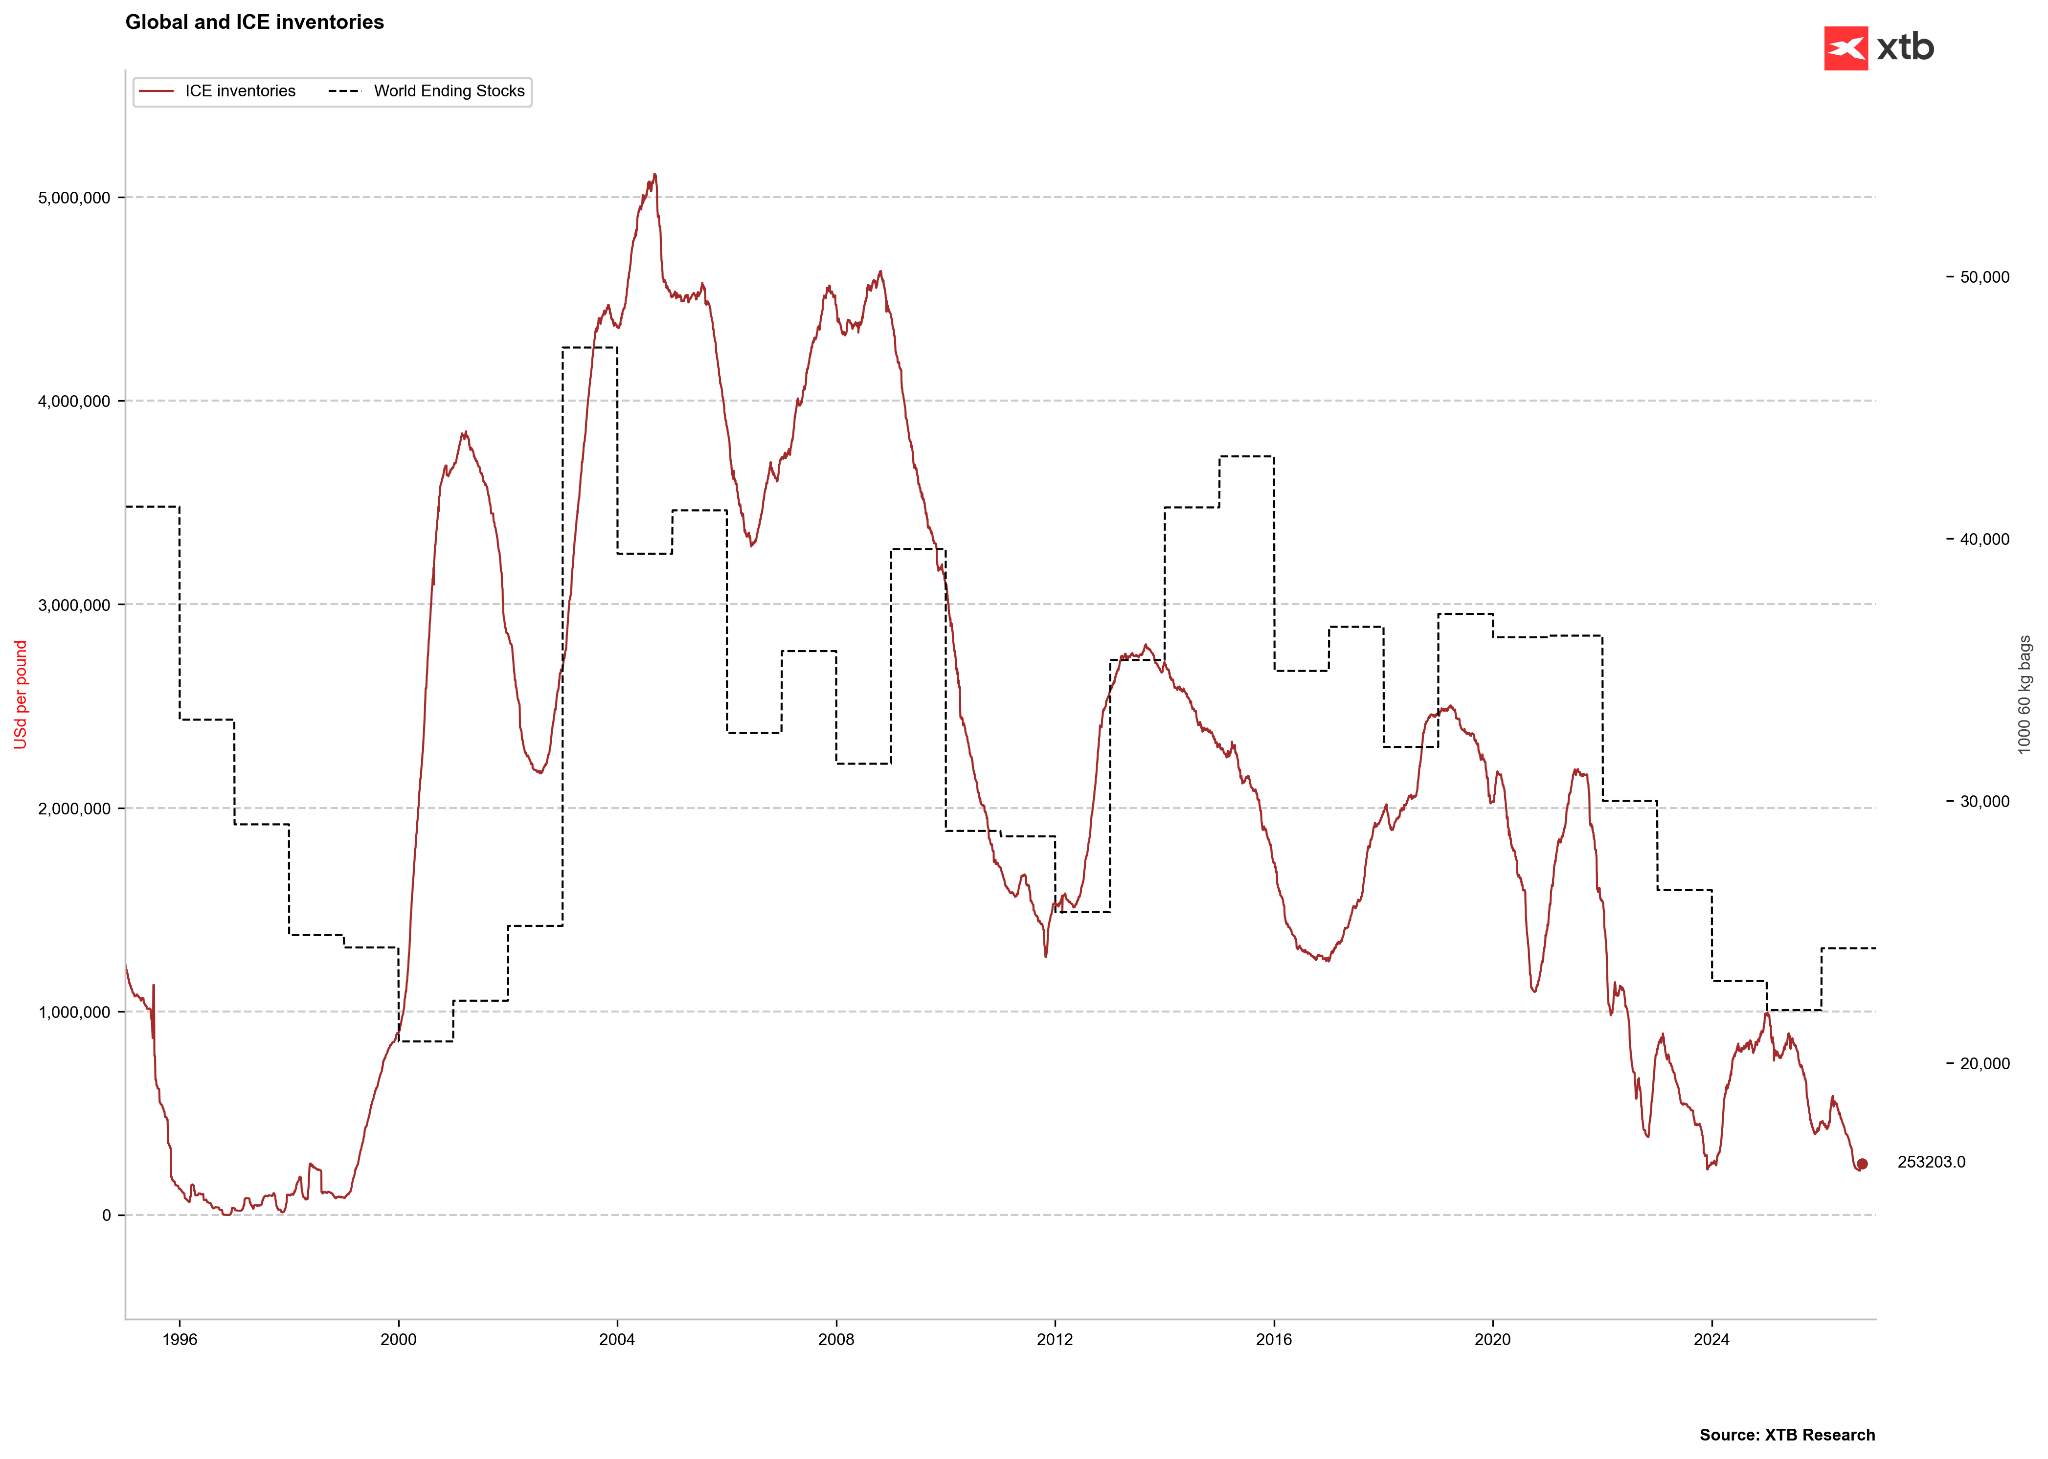 The 26/27 season is projected to bring the first increase in global inventories in many years, which could also spur a rebound in exchange stocks. Source: Bloomberg Finance LP, XTB
Historical Valuation (Z-score) and CFTC Positioning
- The Z-score for coffee stands at -0.74 on a 1-year horizon, -0.85 on a 2-year horizon, and +0.52 on a 5-year horizon.
- Analyzing 5-year Z-score dynamics over the past six months shows that it stood at +0.96 six months ago, dropped to +0.43 three months ago, rebounded to +0.83 one month ago, and has now settled at +0.52.
- According to CFTC data as of September 22, 2026, net speculative positioning stood at +10,273 contracts, with a Z-score of -1.52 and a percentile of 50.3%.
- On a weekly basis, a reduction in speculative exposure of 5,197 contracts was recorded, with the long position share reaching 57.0%.
- The above data points to moderate speculative fund positioning sitting right in the middle of the historical range (percentile near 50%).
- This balance generally confirms a moderate valuation based on the medium-term price Z-score, presenting no immediate risk of forced position unwinding or short squeezes, leaving the market in a technical consolidation phase driven by ongoing weather factors in South America.
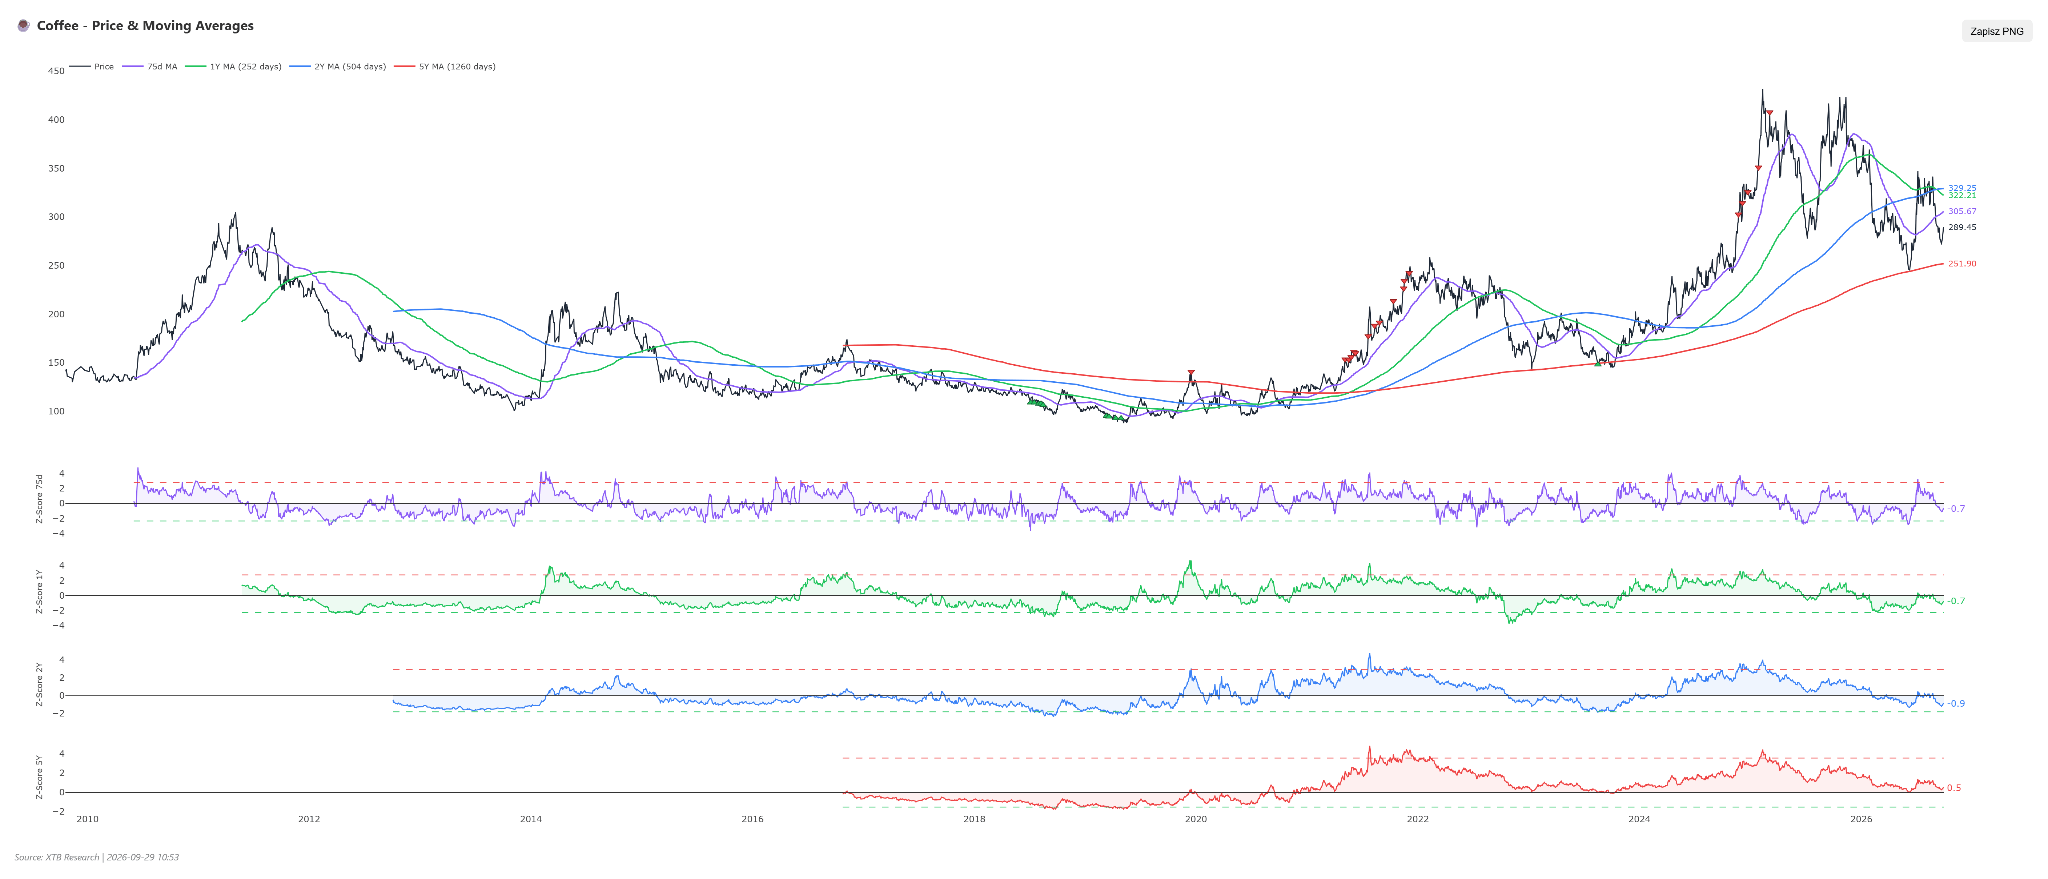 Coffee shows negative deviations from 3-month to 2-year moving averages and sits very close to the 5-year average. Source: Bloomberg Finance LP, XTB
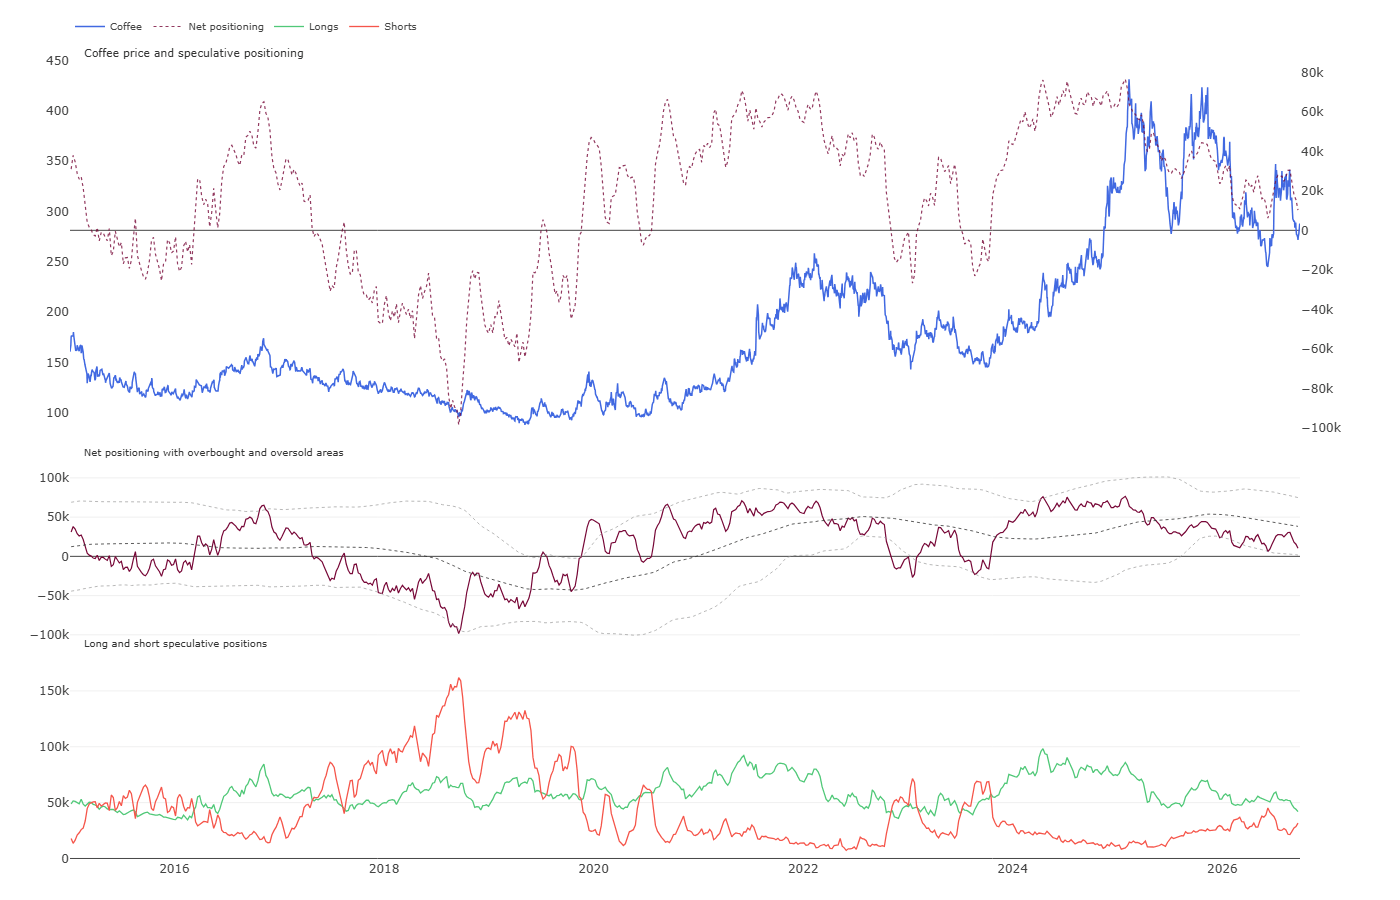 Long positions were recently reduced, falling to their lowest level since 2023. At that time, net positioning was also negative, acting as a contrarian indicator twice three years ago. Source: CFTC, XTB
Scenarios
- Bullish Scenario: This scenario plays out if current technical momentum is sustained following the breakout above key support, combined with additional weather anomalies or periodic droughts in key Brazilian growing regions that could threaten next year's harvest. A necessary condition is also maintaining neutral-to-bullish momentum indicators alongside no sudden surge in South American export volumes. In such an environment, coffee prices could extend their move toward resistance located around USD 3.10 - 3.25 per pound.
- Bearish Scenario: This case assumes a return to dominant, structural bearish fundamentals, driven by the realization of forecasted abundant rainfall encouraging optimal flowering for the new crop in Brazil, alongside sustained record export pace from the country. Technical conditions require breaking below recent support levels and a price drop under USD 2.75 per pound, which would negate current buy signals from the SMA and MACD. Consequently, coffee prices could slide toward the support zone near USD 2.50 - 2.60 per pound.



Morning Wrap: หุ้นเทคเอเชียพุ่งตามผลประกอบการ Micron ขณะที่เยนอ่อนค่า แม้ BoJ ส่งสัญญาณ Hawkish



ข่าวเด่นวันนี้ 1 ต.ค.



Chart of the Day: เงินปอนด์แข็งแกร่งที่สุดในรอบ 1 เดือน


Morning Wrap: AI หนุน Nikkei 225 ปรับตัวขึ้น ขณะที่ราคาน้ำมันลดลง