



Brent crude oil futures (OIL) are rising nearly 2% to around $94 per barrel following reports of a possible escalation of the conflict with Iran, particularly near the strategically important Strait of Hormuz. Reports of attacks near Qeshm Island are raising concerns about the security of oil shipments and potential disruptions to global supply. A further military escalation could push Brent crude prices back above $100 per barrel, increasing inflationary pressures and complicating the outlook for Fed monetary policy.
-
According to Iran's Press TV, air defense forces operated by the Islamic Revolutionary Guard Corps (IRGC) shot down another MQ-1 drone south of Qeshm Island in the Strait of Hormuz. The report has not been independently verified but could indicate a further escalation of tensions in a region critical to global oil trade.
-
Israeli broadcaster N12, citing unofficial sources linked to Iran, reported possible US strikes on Qeshm Island in response to an earlier Iranian attack in Bahrain. Iran's Fars News Agency reported that an explosion had been heard on the island, although its cause remains unknown. Reports of a US strike still require further confirmation.
-
Iranian Foreign Minister Abbas Araghchi met with his Omani counterpart, Badr Al Busaidi, in Muscat. The talks focused on maritime security, regional developments and the possibility of resuming diplomatic dialogue. Oman remains an important intermediary between Tehran and Washington, and potential de-escalation could reduce the geopolitical risk premium embedded in oil prices.
H1 and D1 Charts
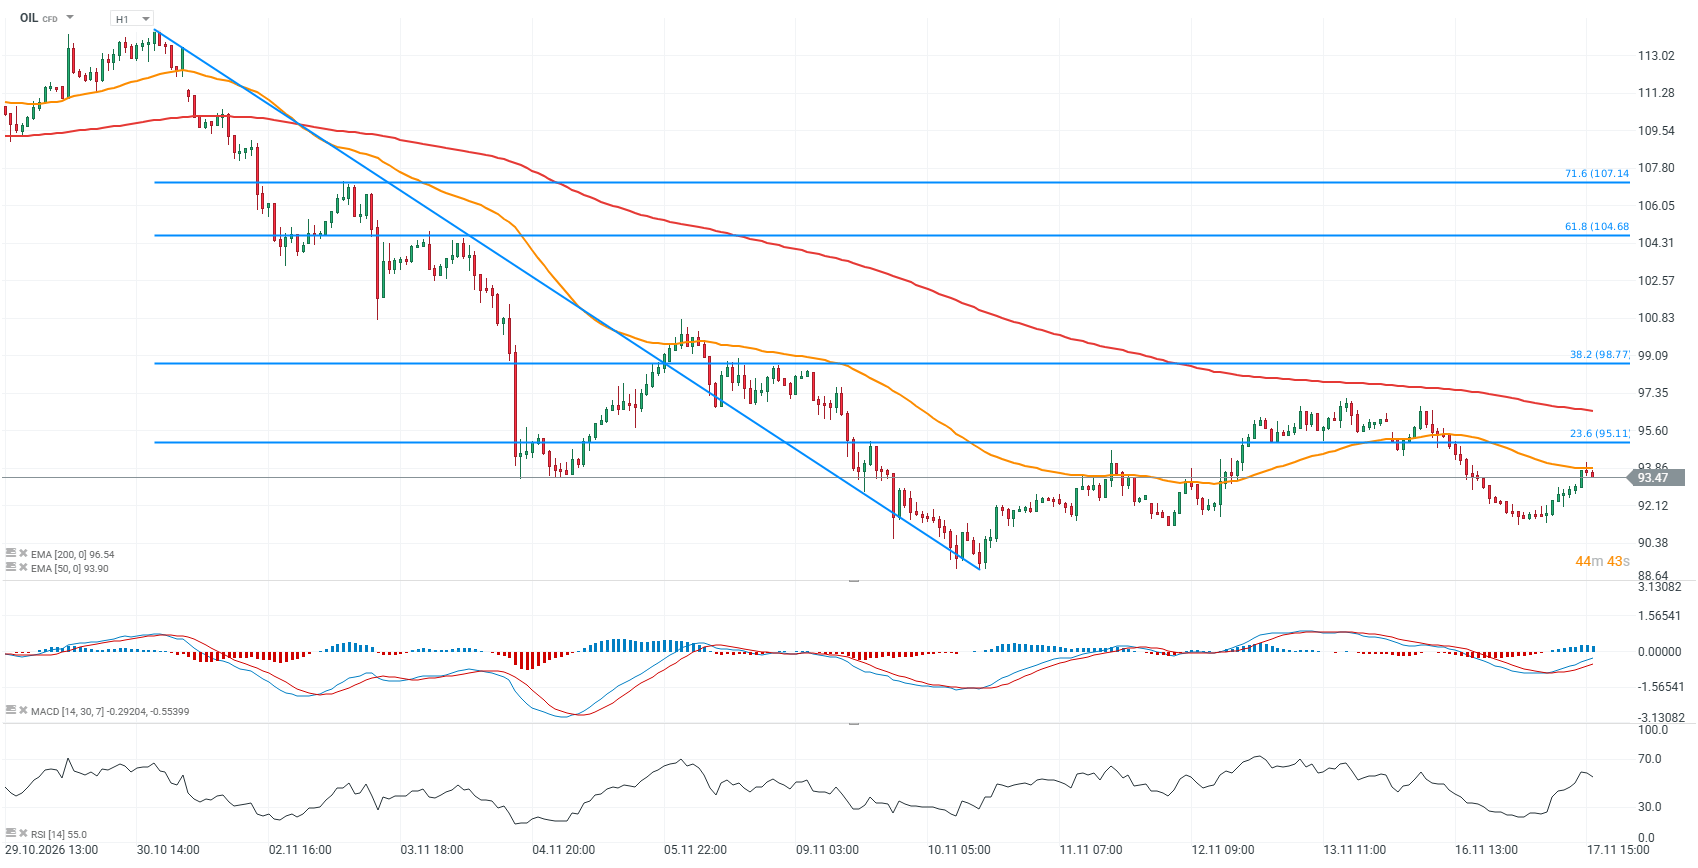
Brent crude oil futures have risen today from around $91.50 to $93.50 per barrel. The 50-period exponential moving average (EMA50, orange line) appears to be the first key resistance level, while the $90 area remains an important support zone.
 Source: XTB
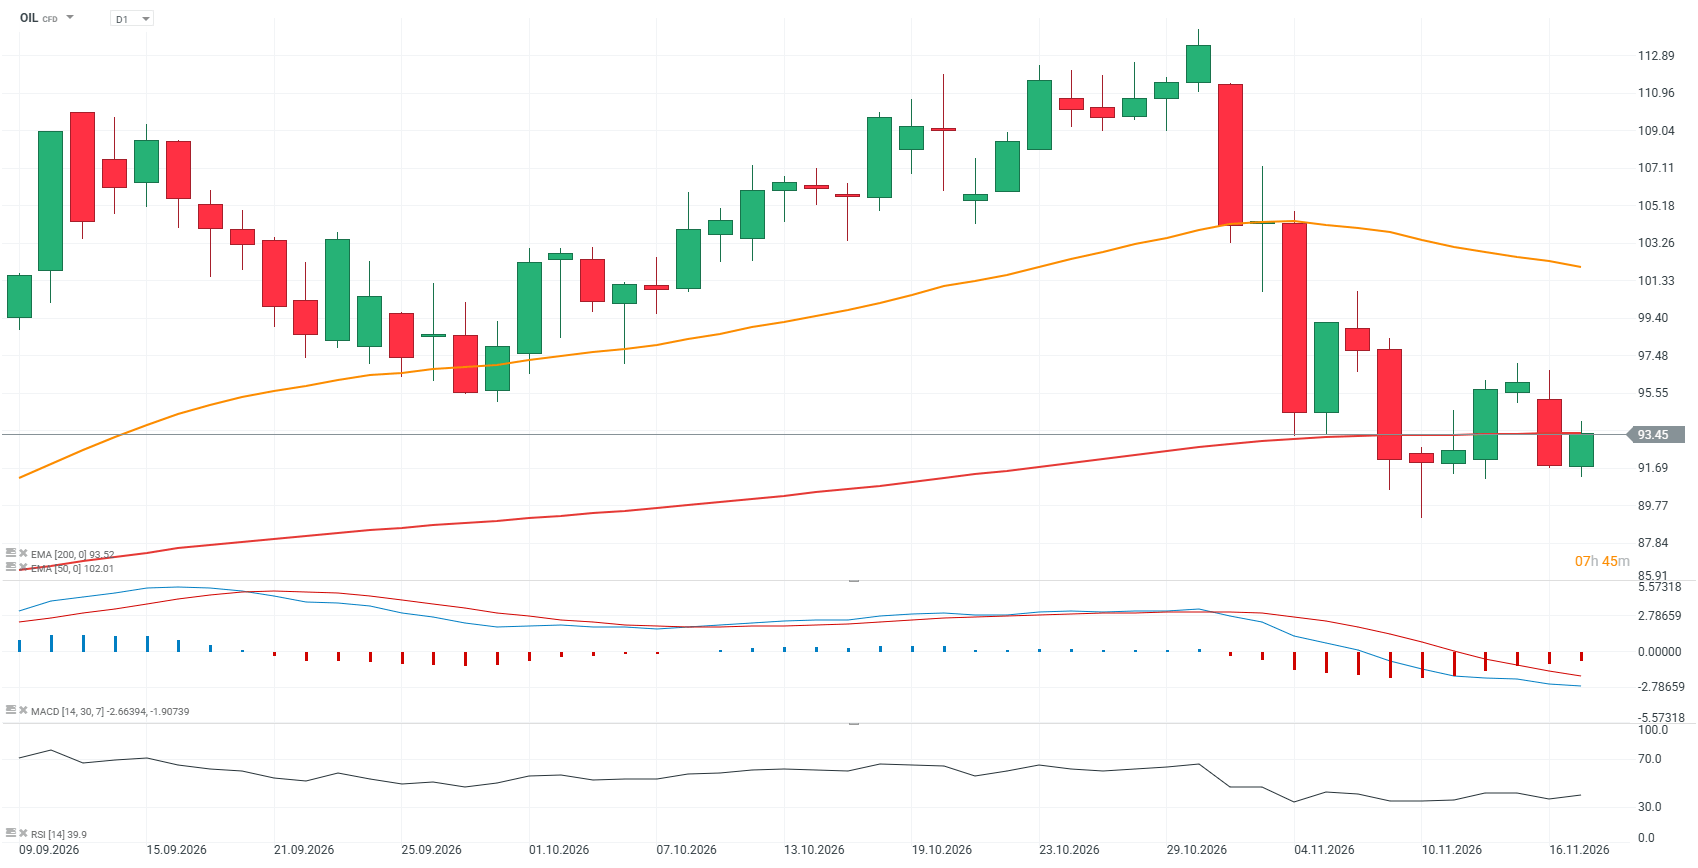
On the daily chart, Brent crude oil futures have pulled back today after reaching the 200-day exponential moving average (EMA200, red line) near $93.50.
 Source: XTB
Brent Crude Oil Seasonality: 2026 Deviates Sharply from Historical Patterns
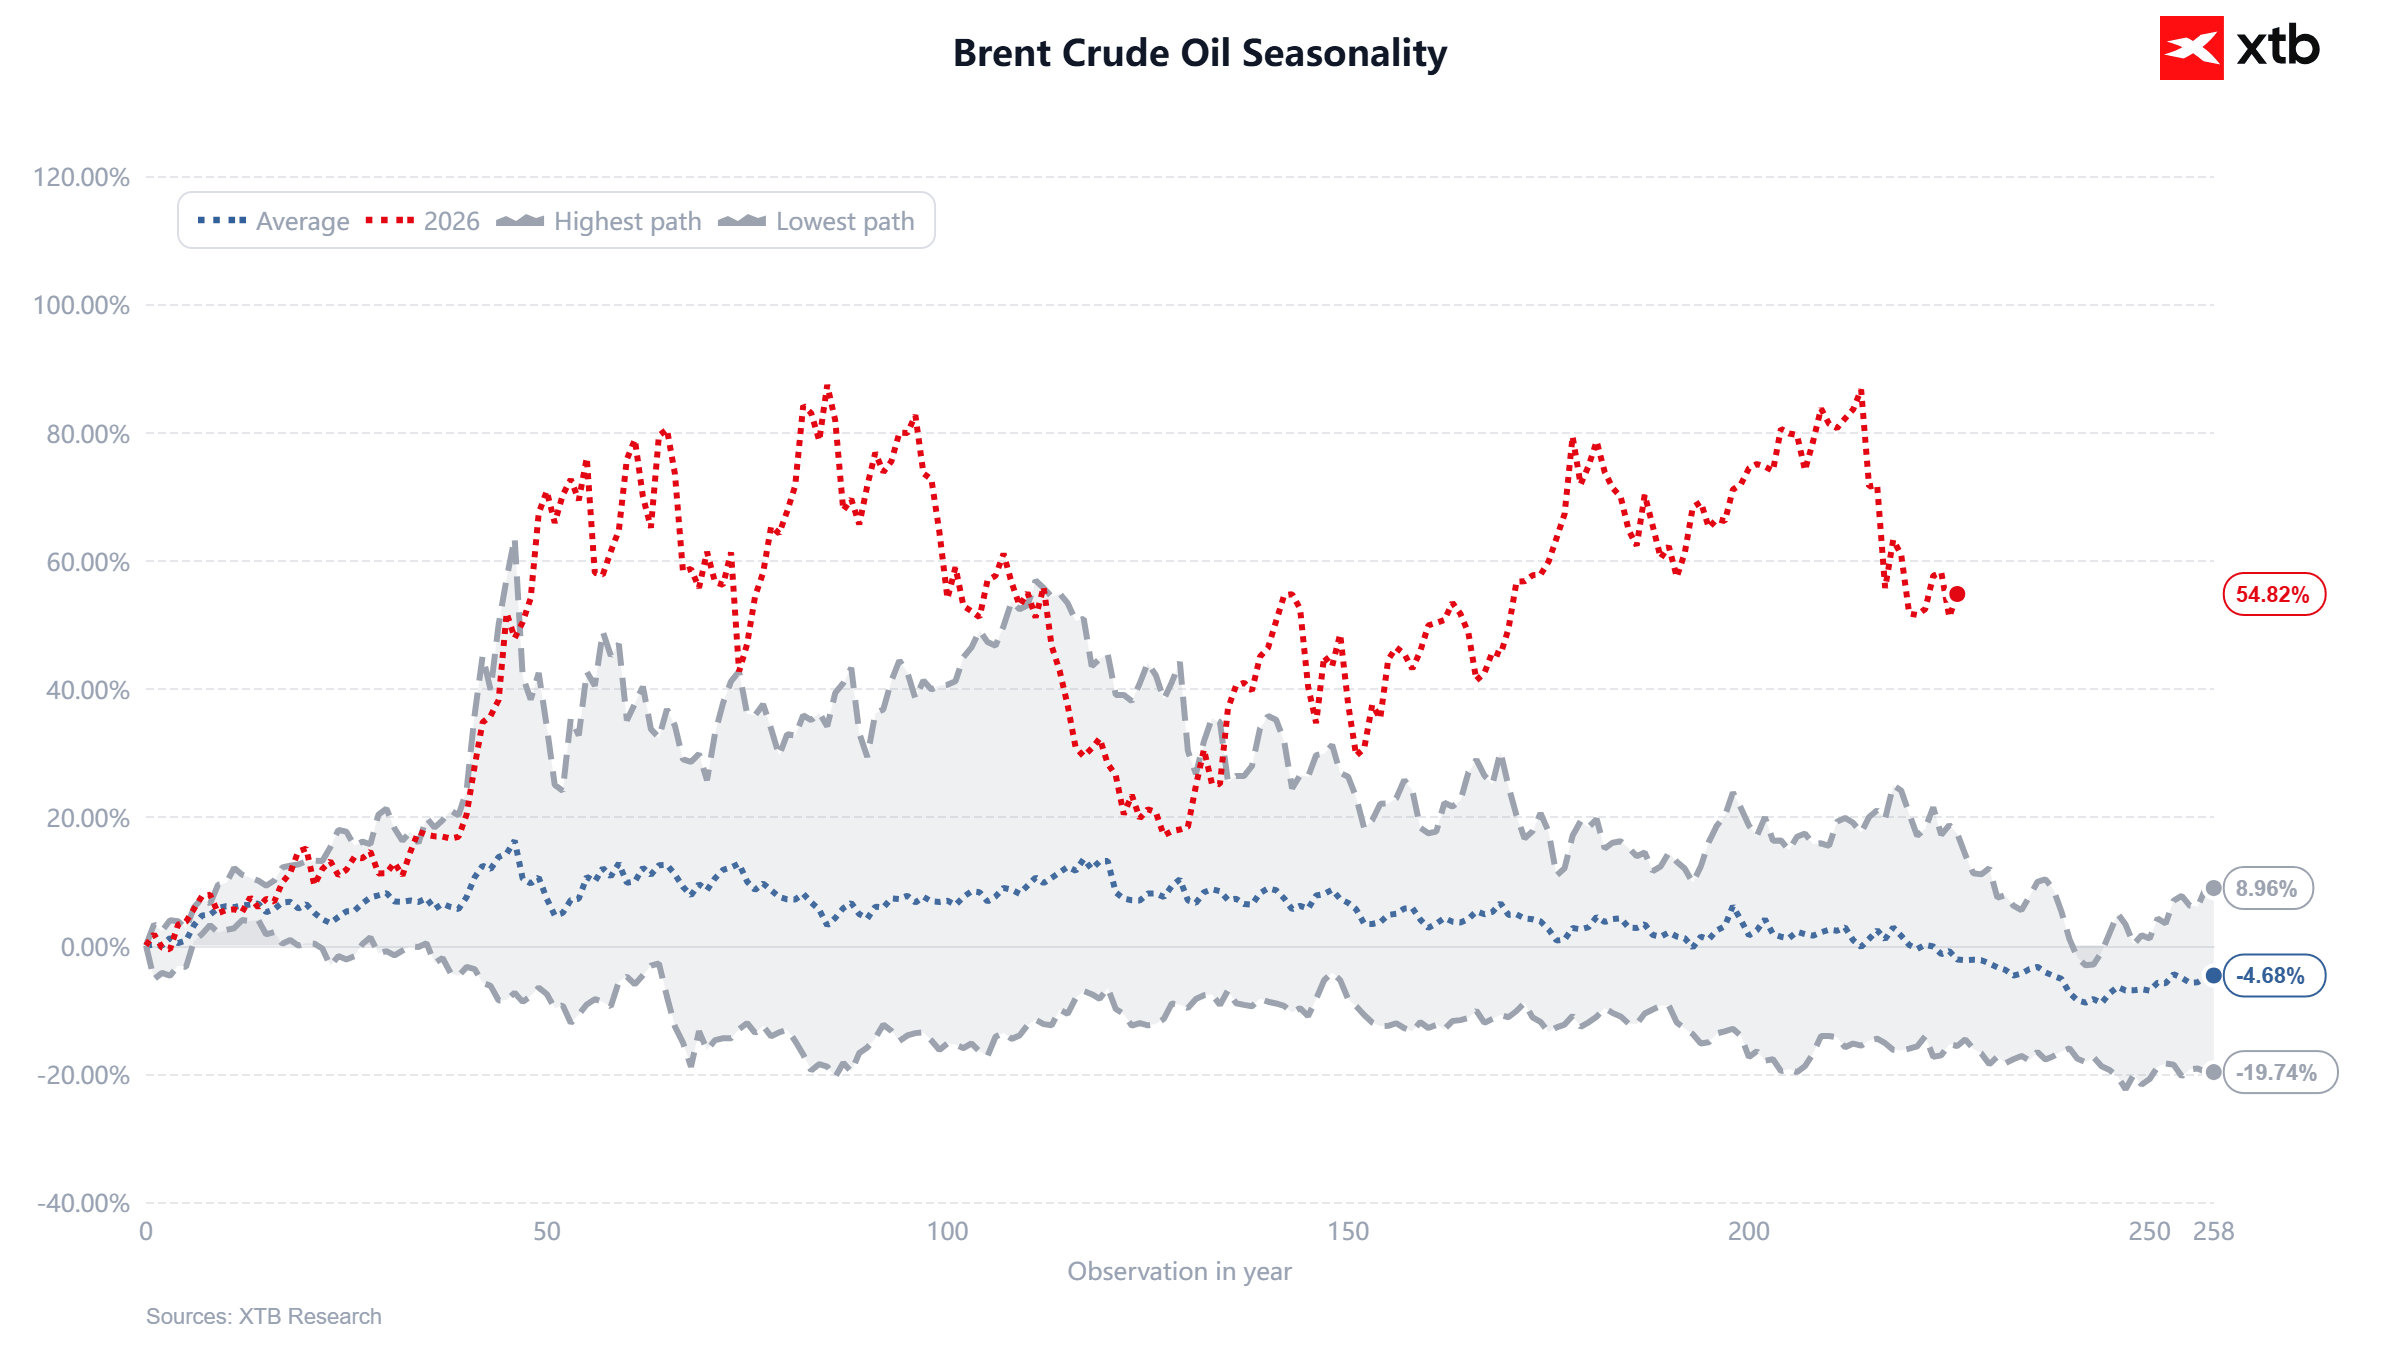
The seasonality chart illustrates just how unusual 2026 has been for the oil market. Brent crude has gained approximately 54.8% year-to-date, compared with a historical average return of -4.7% at the same point in the year. Notably, the 2026 price trajectory has remained above even the strongest historical paths included in the dataset for much of the year. This suggests that factors specific to 2026, particularly supply shocks and geopolitical tensions, have had a far greater impact on prices than typical seasonal patterns.
-
Despite gaining nearly 55% year-to-date, Brent has surrendered a substantial portion of its earlier gains. At its peak, the annual return approached 90%, while the subsequent correction highlights how quickly the market can unwind its risk premium in response to changing supply expectations.
-
Historical seasonality generally points to weaker oil prices toward the end of the year, although its predictive value is limited in the current environment. For futures traders, actual physical oil flows, inventory levels, OPEC+ decisions and potential shipping disruptions through the Strait of Hormuz may prove more important.
 Source: XTB Research
Brent vs WTI: A Wider Brent Premium Signals Tensions in the Global Oil Market
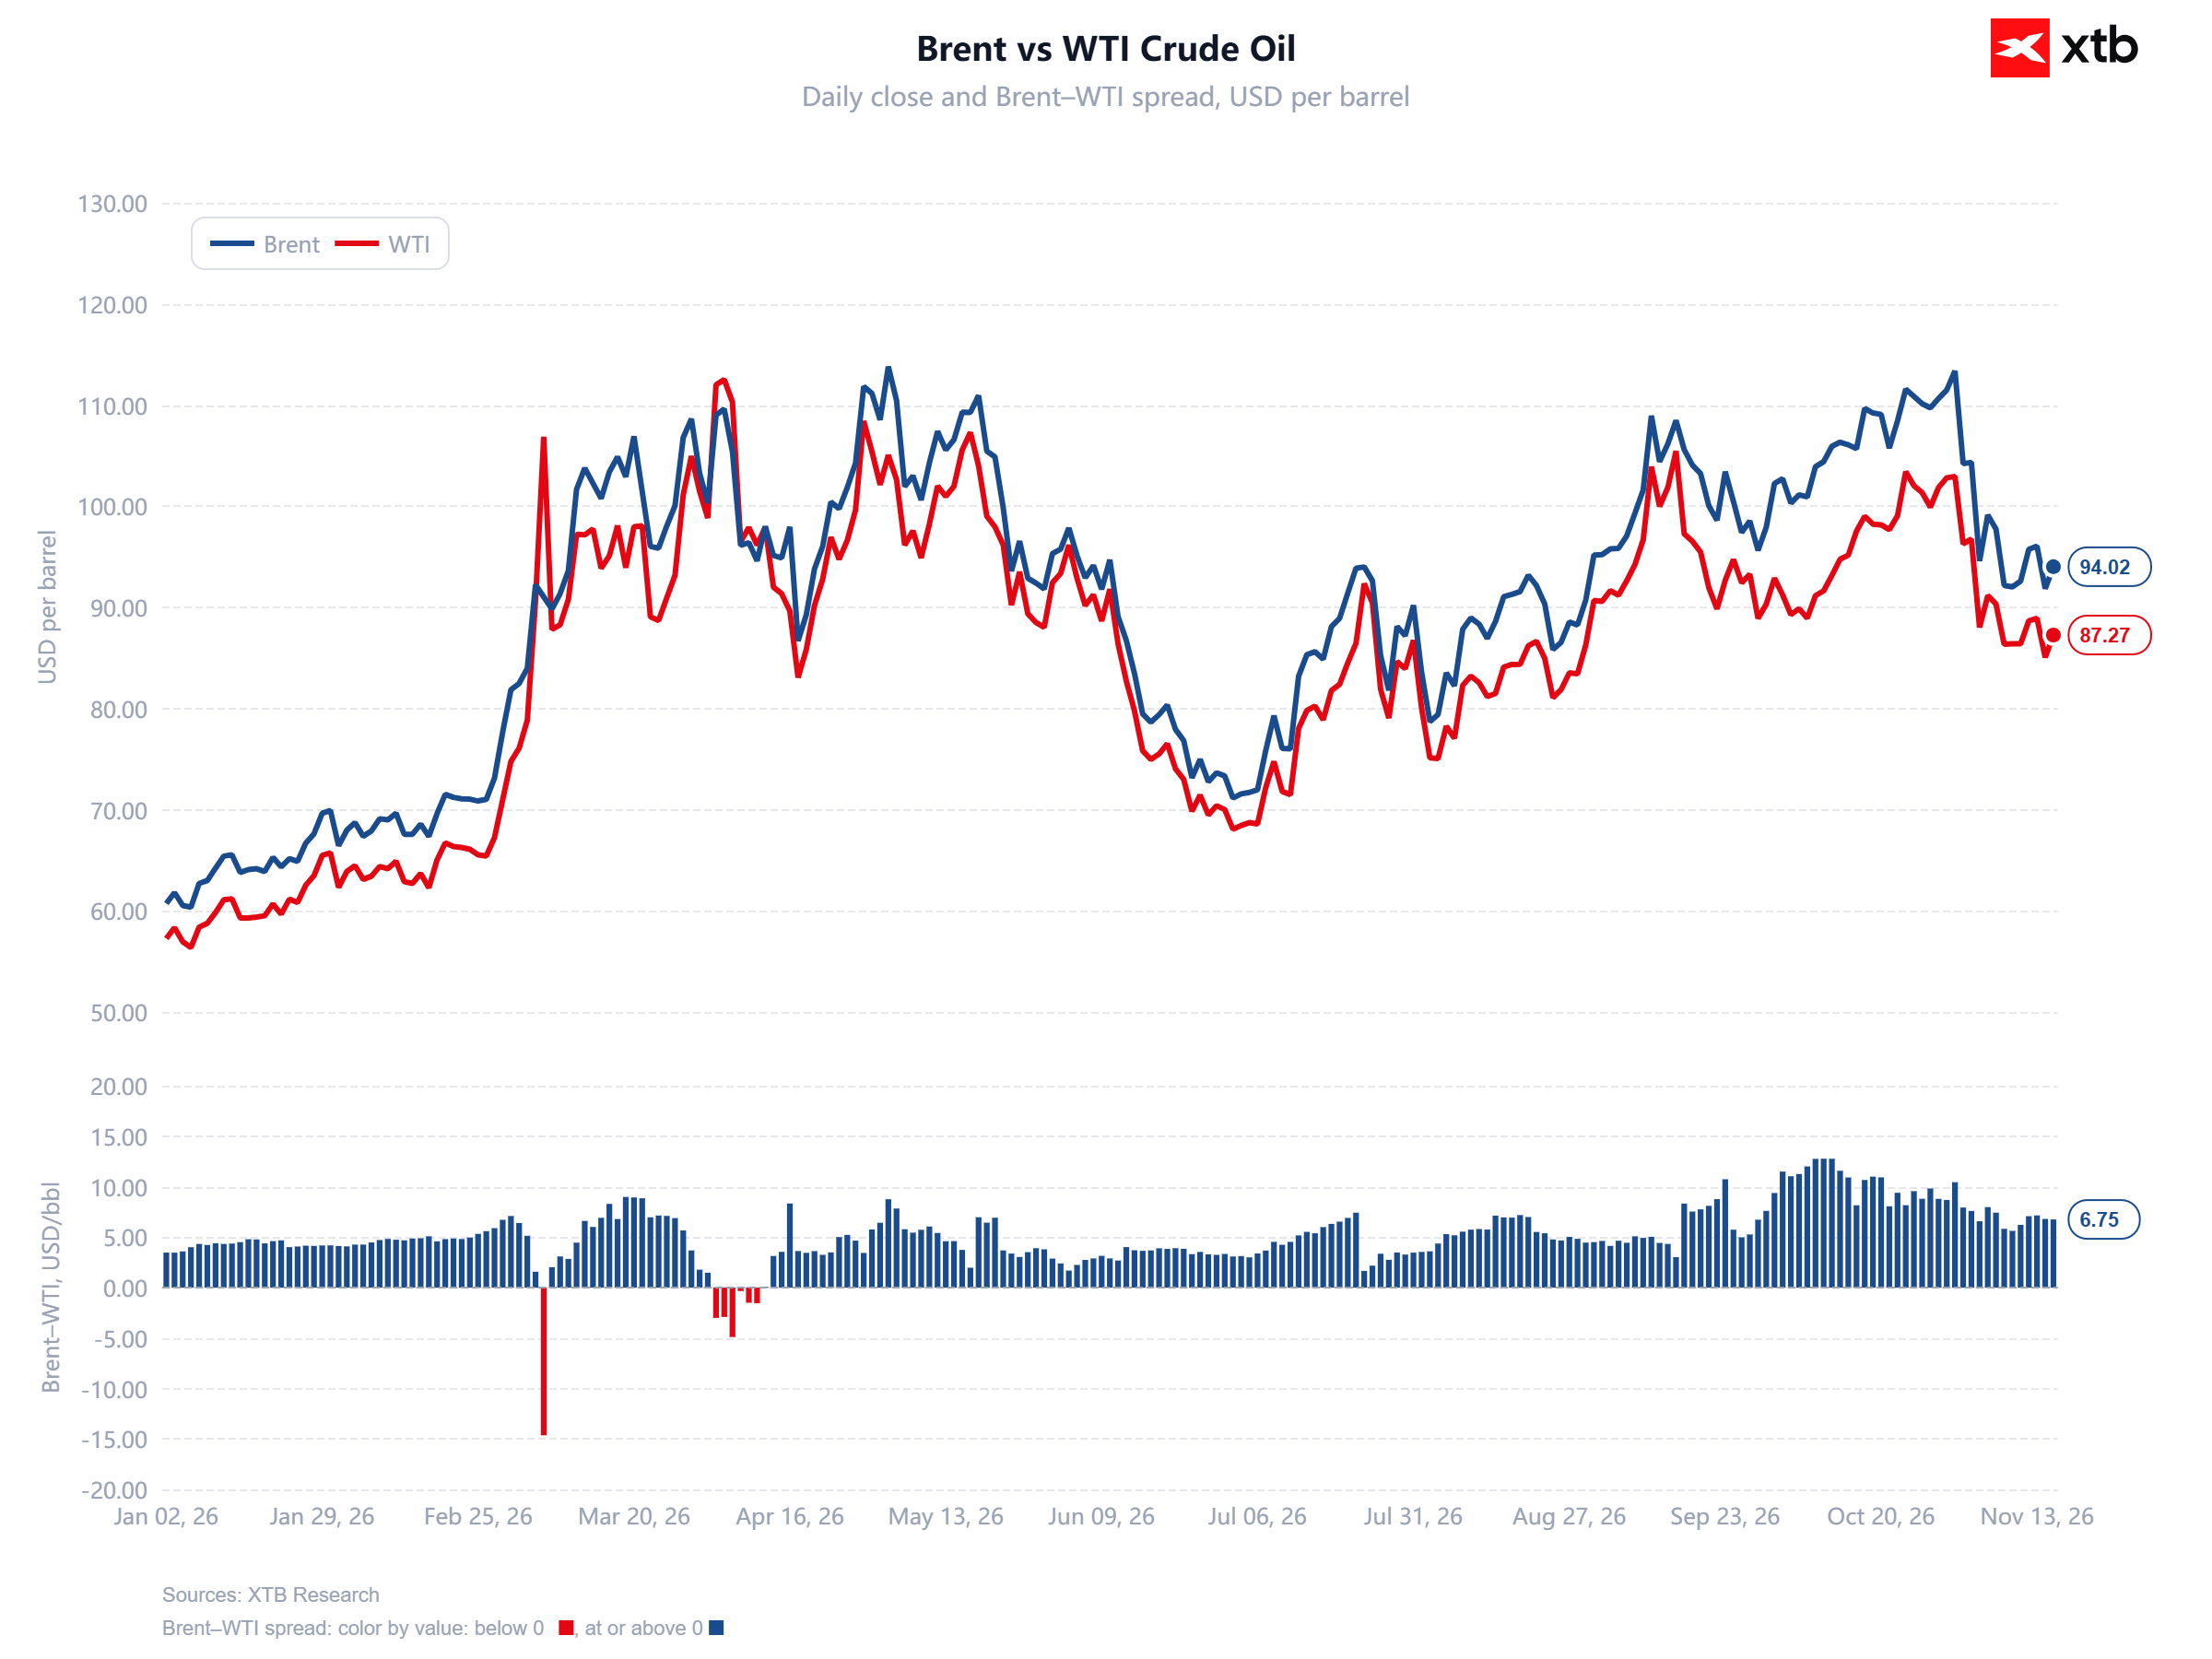
Both Brent and WTI crude oil prices remain well above their levels at the beginning of 2026, but the widening price differential between the two benchmarks is particularly noteworthy. Brent currently trades near $94 per barrel, while US WTI is priced around $87. The Brent–WTI spread stands at $6.75 per barrel, compared with approximately $3–5 at the beginning of the year. Earlier, around late September and early October, the spread exceeded $12 per barrel.
-
A wider Brent–WTI spread may indicate a higher geopolitical and supply risk premium in international oil markets. Brent is more directly exposed to global seaborne oil trade, meaning that tensions in the Middle East and the risk of supply disruptions can have a greater impact on its price than on WTI.
-
A persistently elevated Brent premium does not necessarily indicate an outright oil shortage. The spread is also influenced by US inventories, transportation costs, export infrastructure capacity and differences in refinery demand. For futures traders, an important consideration is whether a widening spread coincides with a strengthening backwardation structure, which could provide additional evidence of tightening physical oil supply.
 Source: XTB Research
Both charts point to an oil market where the supply risk premium remains significant despite the substantial correction from earlier highs. From a trading perspective, monitoring the direction of Brent prices alone may not be sufficient; the behavior of the Brent–WTI spread is equally important. A further widening of this differential, particularly alongside rising Brent prices, could indicate renewed tensions in the global physical oil market. However, the spread alone is not enough to confirm a supply deficit.


Nasdaq extends losses 📉 Will the Wall Street correction last longer?


US Open: Wall Street on Edge Ahead of Nvidia Earnings 🚩 Could Rising Oil Prices Weigh on Stocks?



Oil Prices Rise: US Strikes Iran’s Qeshm Island? 🗽 US Retail Sales Beat Forecasts



Market Wrap: Stocks under pressure, Iceye reaches for Avio
The content of this report has been created by XTB S.A., with its registered office in Warsaw, at Prosta 67, 00-838 Warsaw, Poland, (KRS number 0000217580) and supervised by Polish Supervision Authority ( No. DDM-M-4021-57-1/2005). This material is a marketing communication within the meaning of Art. 24 (3) of Directive 2014/65/EU of the European Parliament and of the Council of 15 May 2014 on markets in financial instruments and amending Directive 2002/92/EC and Directive 2011/61/EU (MiFID II). Marketing communication is not an investment recommendation or information recommending or suggesting an investment strategy within the meaning of Regulation (EU) No 596/2014 of the European Parliament and of the Council of 16 April 2014 on market abuse (market abuse regulation) and repealing Directive 2003/6/EC of the European Parliament and of the Council and Commission Directives 2003/124/EC, 2003/125/EC and 2004/72/EC and Commission Delegated Regulation (EU) 2016/958 of 9 March 2016 supplementing Regulation (EU) No 596/2014 of the European Parliament and of the Council with regard to regulatory technical standards for the technical arrangements for objective presentation of investment recommendations or other information recommending or suggesting an investment strategy and for disclosure of particular interests or indications of conflicts of interest or any other advice, including in the area of investment advisory, within the meaning of the Trading in Financial Instruments Act of 29 July 2005 (i.e. Journal of Laws 2019, item 875, as amended). The marketing communication is prepared with the highest diligence, objectivity, presents the facts known to the author on the date of preparation and is devoid of any evaluation elements. The marketing communication is prepared without considering the client’s needs, his individual financial situation and does not present any investment strategy in any way. The marketing communication does not constitute an offer of sale, offering, subscription, invitation to purchase, advertisement or promotion of any financial instruments. XTB S.A. is not liable for any client’s actions or omissions, in particular for the acquisition or disposal of financial instruments, undertaken on the basis of the information contained in this marketing communication. In the event that the marketing communication contains any information about any results regarding the financial instruments indicated therein, these do not constitute any guarantee or forecast regarding the future results.