
U.S. bank stocks kicked off earnings season on Wall Street today and are trading lower, despite all institutions delivering very solid results, reporting earnings per share significantly above expectations. Revenues also beat Wall Street forecasts. However, the market is pricing in a series of interest rate cuts in 2026, and possibly even a first cut later this year, which leads investors to react somewhat cautiously to the current figures. They see them as difficult to sustain in the medium term if rates decline, reducing lenders' profitability. As for now, strong bank earnings reports suggest profit-taking in pre-market hours.
JPMorgan (JPM.US) Q2 2025 Earnings
Not only did JPMorgan deliver a strong report, but even its significantly higher forecast for net interest income failed to lift shares of the largest U.S. bank. Before the U.S. market open, the stock is down around 1%, although the final market reaction will become clearer once the session begins.
-
Earnings per share (EPS): $5.24 vs Est. $4.47
-
Adjusted revenue: $45.68B vs Est. $44.05B
-
Provision for credit losses: $2.85B, Est. $3.22B
-
Return on equity (ROE): 18%, Est. 15.1%
-
Cash and due from banks: $23.76B, Est. $22.07B
-
Standardized CET1 ratio: 15%, Est. 15.4%
-
Managed net interest income: $23.31B, Est. $23.59B
-
Total deposits: $2.56T, Est. $2.5T
-
Loans: $1.41T, Est. $1.36T
-
Net charge-offs: $2.41B, Est. $2.46B
-
Equities sales & trading revenue: $3.25B, Est. $3.2B
-
Investment banking revenue: $2.68B, Est. $2.16B
-
FICC sales & trading revenue (fixed income, currencies, commodities): $5.69B, Est. $5.22B
-
FY net interest income forecast: approx. $95.5B (previously projected at approx. $94.5B)
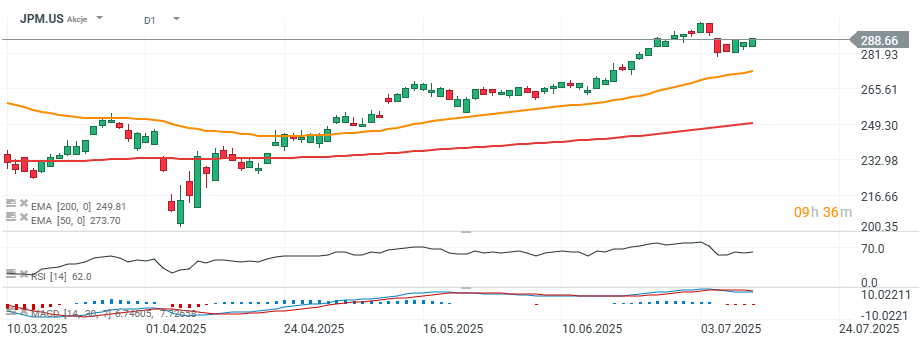
Source: xStation5
Wells Fargo (WFC.US) Q2 2025 Earnings
-
Earnings per share (EPS): $1.60 vs Est. $1.41
-
Revenue: $20.82B vs Est. $20.75B
-
Net interest income: $11.71B, Est. $11.83B
-
Non-performing assets (NPA): $7.96B, Est. $8.68B
-
Non-interest expenses: $13.38B, Est. $13.4B
-
Provision for credit losses: $1.01B, Est. $1.16B
-
Total average deposits: $1.33T, Est. $1.35T
-
Investment banking fees: $696M, Est. $703.1M
-
FY net interest income forecast: approx. $47.7B, Est. $47.92B
Citigroup (C.US) Q2 2025 Earnings
-
Earnings per share (EPS): $1.96 vs Est. $1.60
-
Revenue: $21.67B vs Est. $21B
-
Adjusted FY revenue forecast: approx. $84B (previous guidance: $83.1B–$84.1B)
-
FICC sales & trading revenue (fixed income, currencies, commodities): $4.27B, Est. $3.92B
-
Investment banking revenue: $1.92B, Est. $1.65B
-
Equities sales & trading revenue: $1.61B, Est. $1.55B
-
Net interest income: $15.18B, Est. $14.05B
From Euphoria to Correction: CoreWeave and the Future of AI Infrastructure
EU Fines for Tech Giants — Their Role in EU/USA Competition
DE40: European stocks are falling as markets await U.S. data
End of Zillow? Google enters another market.