
Despite the strong sentiment in the US equity market, Bitcoin has pulled back to just below $74,000, struggling to maintain its upward trend. Selling pressure has re-emerged around the key $74,000–$76,000 range. The technical weakness is clearly visible on the chart, and if the price fails to break above and hold the $75,000 level in the near term, the base scenario may shift toward accelerated profit-taking. This could lead to buyer capitulation and a move back toward $68,000 or lower. A drop below $68,000 could indicate increasing pressure to retest the lows from late January and early February 2026.
Looking at Fibonacci retracements, there are some similarities between the current downward move and the previous one. Selling pressure has once again appeared around the 38.2% Fibonacci retracement of the January decline, just as this level acted as a key resistance point during the earlier bearish impulse that began in autumn 2025 and ended with a sharp drop after rejection near $97,700. Currently, the $74,000–$75,000 zone appears to be playing a similar technical role as a major resistance zone which may trigger a major breakdown to the upside or another, strong downward impulse.
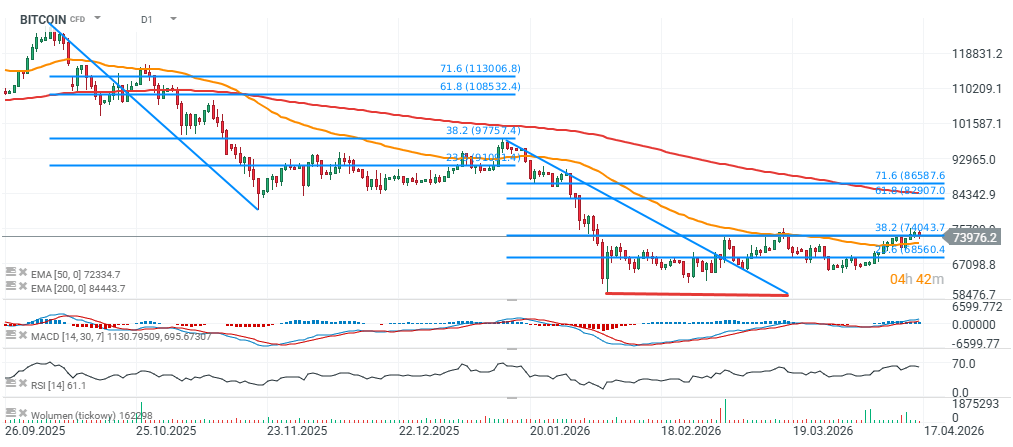
Source: xStation5

💯Daily Summary - Wall Street Close to Records Ahead of Long Weekend

🔴A New Era at the Fed: Kevin Warsh Takes the Helm. US30 above 50k

Is Waller echoing Warsh's stance? Keeping rates steady but pressing ahead with balance sheet reduction?

US OPEN: Wall Street Nears Record Highs Ahead of Long Weekend, Powered by AI