
EBITDA is a widely used financial metric for assessing a company’s operating performance. This article explains what EBITDA means, its full form, formula, and how to calculate it, with a simple breakdown of each component. It also covers how EBITDA is used in financial analysis and business valuation, its relationship with cash flow, and the key limitations investors should understand when interpreting the metric.
EBITDA is a widely used financial metric for assessing a company’s operating performance. This article explains what EBITDA means, its full form, formula, and how to calculate it, with a simple breakdown of each component. It also covers how EBITDA is used in financial analysis and business valuation, its relationship with cash flow, and the key limitations investors should understand when interpreting the metric.


EBITDA stands for Earnings Before Interest, Taxes, Depreciation and Amortisation, and it serves as a widely used metric to measure a company's operating profitability. It is typically calculated by taking the operating income and adding back depreciation and amortisation, which can result in an EBITDA of $1.5 million for a company with $1 million in operating income and $500,000 in depreciation. Investors use this metric to compare the operational performance of different companies by stripping away the impact of their capital structures and tax rates, though it comes with the notable limitation of ignoring capital expenditures (capex).
Key takeaways
-
EBITDA full form: It is an acronym that means earnings before interest, taxes, depreciation and amortisation.
- Formula: You can calculate it by adding depreciation and amortisation to operating income, or by working backwards and adding non-operating expenses to net income.
- Primary use: Investors use it to evaluate and compare core operating profitability without the distortion of debt, taxes, and non-cash accounting rules.
- Main limitation: It is not a substitute for free cash flow, as it ignores critical costs like capital expenditures and working capital changes.
What Is EBITDA? Meaning, Formula and How to Calculate It
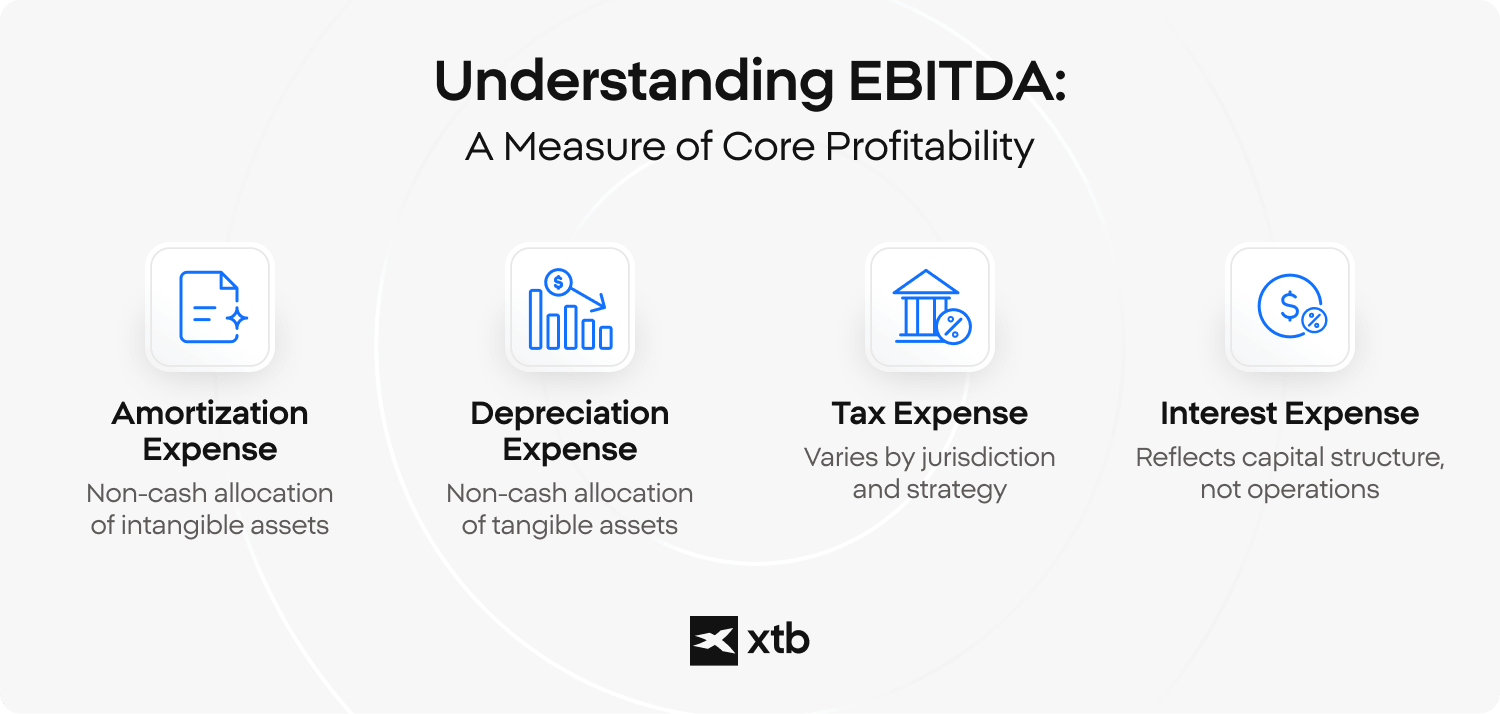
EBITDA is an acronym for earnings before interest, taxes, depreciation and amortisation, representing a measure of a company's operating profitability before deducting these specific financial and accounting expenses. This metric helps you understand what a company earns purely from its core business operations. To fully grasp what EBITDA means, it helps to break down the acronym into its individual components:
- Earnings: This refers to the core profit generated by the business operations over a specific period.
- Before: This indicates that the subsequent items have not yet been subtracted from the earnings figure (or have been added back).
- Interest: This represents the cost of servicing debt or the income earned from cash balances, reflecting the capital structure rather than operations.
- Taxes: This is the income tax expense paid to governments, which varies based on jurisdiction and tax strategies.
- Depreciation: Depreciation, in EBITDA refers to the non-cash accounting allocation of the cost of tangible assets (like machinery or real estate) over their useful lives.
- Amortization: Amortisation in EBITDA refers to the non-cash accounting allocation of the cost of intangible assets (like patents, trademarks, or software) over time.
|
❓ Did you know? EBITDA was popularized in the 1980s during the boom of leveraged buyouts (LBOs). Investors used it to determine whether a target company had enough operating profitability to service the massive debt required to finance the acquisition. Although EBITDA proved useful for comparing businesses, critics have long pointed out that it is not a cash flow metric because it excludes capital expenditures, changes in working capital, interest expenses, and taxes. |
What is the EBITDA formula, and how do you calculate it?
EBITDA is calculated in two primary ways: the bottom-up approach starting from net income, or the top-down approach starting from operating income. Knowing how to read financial statements is essential, as you will pull the necessary data points primarily from the company's income statement and cash flow statement.
The bottom-up formula starts with the final profit figure and adds back the non-operating and non-cash expenses:

The top-down formula starts higher up on the income statement, taking the operating income (which already excludes interest and taxes) and adding back the non-cash expenses:

|
📌 Example Imagine a fictional manufacturing business called TechCorp reporting its annual financials. The company generated $10,000,000 in revenue. After subtracting all operating and non-operating expenses, it reported a net income of $1,500,000. The income statement shows interest expenses of $400,000 and tax expenses of $500,000. The cash flow statement reveals depreciation of $800,000 and amortisation of $200,000. Using the bottom-up approach: $1,500,000 (net income) + $400,000 (interest) + $500,000 (taxes) + $800,000 (depreciation) + $200,000 (amortization) = an EBITDA of $3,400,000. |
EBITDA Margin, Interest Coverage and EV/EBITDA Explained
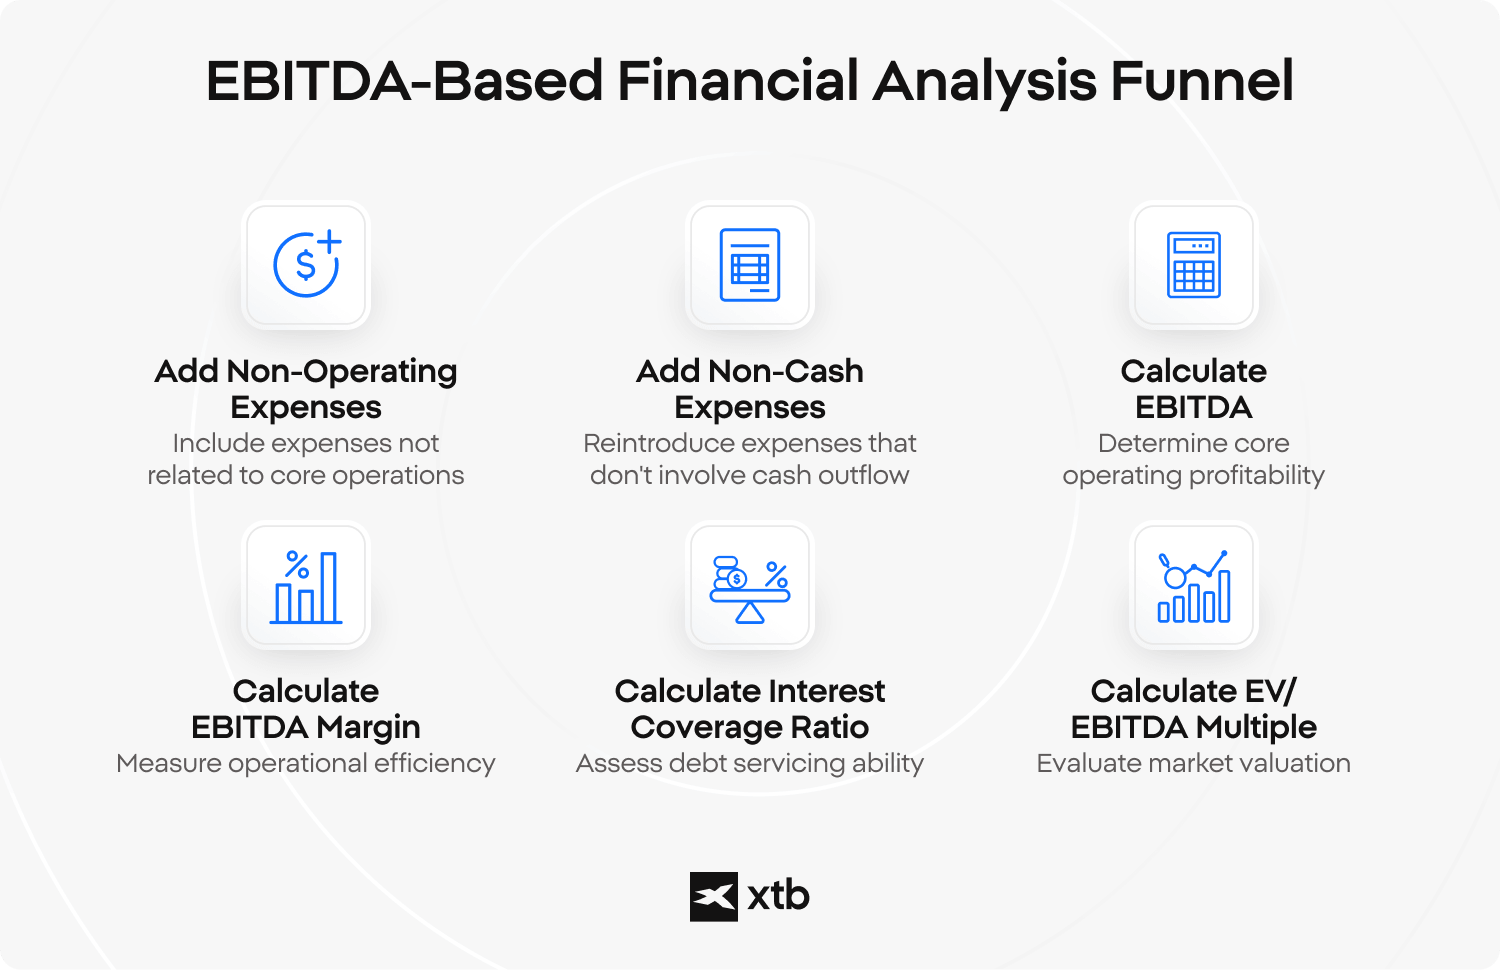
Once EBITDA has been calculated, investors often use it as a starting point for several related indicators, including EBITDA margin, interest coverage and EV/EBITDA. These metrics help assess operating efficiency, debt-servicing capacity and valuation, although none of them should be used in isolation. To see how this works, consider a practical scenario of a hypothetical retail company generating $5,000,000 in total revenue.
Its financial statements report a net income of $500,000, an interest expense of $100,000, taxes of $150,000, and total depreciation and amortisation of $250,000. Assuming the company has an Enterprise Value (EV) of $8,000,000, here is how you calculate the core metric and its most common financial indicators:
- EBITDA baseline: You find the core operating metric by adding the non-operating and non-cash expenses back to the net income ($500,000 + $100,000 + $150,000 + $250,000), resulting in an operating profitability of $1,000,000.
- EBITDA margin: You measure the company's operational efficiency by dividing the EBITDA ($1,000,000) by its total revenue ($5,000,000), giving you a margin of 20%. This percentage tells you that for every dollar of sales generated, the company retains 20 cents in core operating earnings.
- Interest coverage ratio: You assess the company's ability to comfortably pay its debt obligations by dividing the EBITDA ($1,000,000) by its interest expense ($100,000), yielding a coverage ratio of 10x. A higher multiple indicates to investors that the business generates more than enough operational cash flow to service its current debt.
- EV/EBITDA multiple: You evaluate the company's market valuation by dividing its total Enterprise Value ($8,000,000) by its EBITDA ($1,000,000), resulting in an 8x multiple. Investors frequently use this indicator instead of the traditional P/E ratio to compare the valuations of potential acquisition targets, as it accounts for both debt and operational efficiency.
What does EBITDA actually tell you, and why do investors use it?
EBITDA shows the profitability of a company's core operations independently of its capital structure, taxes, and accounting decisions, making it easier to compare businesses against each other. When you look at net income, a company with high debt will look less profitable than an identical debt-free company due to interest payments. By focusing strictly on operating profitability, EBITDA removes these structural and jurisdictional distortions, acting as a proxy for operating cash flow.
Because it strips away variable structural costs, investors use it as a foundational baseline metric, but it is often combined with other derivative ratios to get a complete picture of valuation and margins. For instance, comparing the metric against total revenue gives you the EBITDA margin, which expresses operating profitability as a percentage.
Analysts also frequently contrast EBIT vs EBITDA to see the exact impact of non-cash depreciation on the bottom line. Furthermore, in valuation processes, investors divide the enterprise value by this metric to find the EV/EBITDA ratio, commonly known as an EBITDA multiple. In cases where a company has significant one-off expenses, analysts might look at an adjusted EBITDA to normalize the earnings further
What are the limitations of EBITDA?
EBITDA ignores capital expenditures (capex), working capital changes, and debt service costs, meaning it can overstate a company's real ability to generate cash. While it is a highly useful comparative tool, relying on it blindly can mask deep financial obligations and cash drains within a business. A 2018 research paper by Bouwens, De Kok and Verriest suggests[1] that EBITDA can make profitability and cash generation appear stronger than they are, particularly in leveraged and capital-intensive companies.
One of the biggest misconceptions is that EBITDA is identical to cash flow. It is not. Because it ignores capital expenditures, it fails to account for the actual cash a company must spend to maintain or expand its physical asset base. Furthermore, it is not the same as gross profit; gross profit only subtracts the cost of goods sold from revenue, while EBITDA also subtracts everyday operating expenses. This makes it distinct from more complex valuation methods, such as a discounted cash flow analysis.
Critics often point out that this metric can be manipulated by management or that it hides true vulnerabilities during economic downturns, because the interest and taxes it ignores still represent real, mandatory cash outflows. This is why companies sometimes present an adjusted EBITDA to smooth out numbers, a practice which requires scrutiny by investors to ensure legitimate ongoing expenses are not being hidden.
|
⚠️ Caution EBITDA does not replace free cash flow. A company can have a positive and growing operating profitability profile but still go bankrupt if it cannot cover its real-world interest payments or massive capital expenditure requirements. |
What do professional investors think about EBITDA?
EBITDA remains one of the most debated metrics in financial analysis. It is useful because it removes the impact of interest, taxes, depreciation and amortisation, making companies easier to compare. The problem is that this same simplicity can also hide important costs.
- Warren Buffett has long warned that EBITDA can make businesses look healthier than they really are, because depreciation often reflects the real cost of replacing assets.
- Charlie Munger was even more direct, arguing that EBITDA can resemble “bullshit earnings” when investors treat it as a substitute for real cash generation.
- Howard Marks has also cautioned against relying too heavily on simplified valuation measures, especially when they encourage investors to overlook debt, capital intensity or business quality.
- Ashwath Damodoran shared similar concerns, emphasising that EBITDA should never be confused with cash flow.
At the same time, EBITDA still has its uses. Private equity firms, lenders and M&A analysts often use it as a starting point for comparing companies with different capital structures, tax profiles and accounting policies. EBITDA can help measure operating profitability, but it should be checked against free cash flow, capital expenditures, debt levels and working capital needs.
FAQ
Not necessarily. A higher EBITDA generally indicates stronger operating profitability, but it does not automatically mean a company is financially healthier. Investors should also evaluate free cash flow, debt levels, capital expenditure requirements and profit margins, since EBITDA excludes several important costs.
There is no universal benchmark because EBITDA margins vary significantly across industries. Asset-light businesses such as software companies often report much higher EBITDA margins than manufacturers, utilities or airlines, where depreciation and capital investment are substantially greater. The most meaningful comparison is usually between companies operating within the same industry.
EBITDA excludes non-cash expenses such as depreciation and amortization, but it also ignores capital expenditures, changes in working capital, interest payments and taxes. Cash flow reflects the actual movement of cash into and out of a business, making it a broader measure of financial health.
Many companies report Adjusted EBITDA to exclude one-time or non-recurring items such as restructuring costs, legal settlements or acquisition-related expenses. The objective is to present a clearer picture of recurring operating performance. However, investors should review these adjustments carefully, as companies may define Adjusted EBITDA differently
EBITDA is commonly used in capital-intensive industries where depreciation is significant, including manufacturing, telecommunications, energy, mining, transportation and real estate. It is also one of the most frequently used metrics in mergers and acquisitions (M&A), private equity and corporate valuation.
Yes. A company may report positive EBITDA while recording a net loss because interest expenses, taxes, depreciation and amortization are deducted after EBITDA. It is also possible for a company with positive EBITDA to experience negative free cash flow if capital expenditures or debt repayments are substantial.
EV/EBITDA incorporates both a company's equity and debt through Enterprise Value, making it easier to compare businesses with different financing structures. Unlike the P/E ratio, it is less affected by interest expenses, tax rates and accounting policies, which is why it is widely used in valuation and acquisition analysis.
No. EBITDA is more informative for some businesses than others. Companies with high capital expenditure requirements or significant debt may appear stronger than they actually are if EBITDA is viewed in isolation. For this reason, professional investors typically combine EBITDA with free cash flow, leverage ratios and other profitability metrics before drawing conclusions.