
-
Asian equities under heavy pressure: The MSCI Asia Pacific Index fell as much as 2.8%, marking the largest two-day decline since April.
-
Sharp sell-off in South Korea: The KOSPI index dropped as much as 6.8% after markets reopened following a long weekend, despite having been one of the best-performing indices globally earlier this year.
-
Western futures signal further downside: Equity-index futures in the US and Europe declined by around 1%, pointing to a potential continuation of the correction.
-
Iran–US/Israel escalation pushes oil higher: Investors are focusing on supply risks, particularly after Iran threatened to close the Strait of Hormuz, a critical global oil transit route.
-
Brent back above $80 per barrel: Oil prices once again moved above $80, following a “moderate” surge of more than 7% on Monday.
-
US dollar strengthens: Rising risk aversion and geopolitical tensions are supporting gains in the US currency.
-
Bonds retreat despite safe-haven status: Higher oil prices are reviving inflation concerns, lifting rate expectations and weighing on global fixed-income markets.
-
Government debt sell-off from Sydney to Tokyo: Investors are offloading sovereign bonds amid fears that a prolonged Middle East conflict will sustain inflationary pressure.
-
Broad-based bond declines: Government bonds in the US, Japan, Australia, New Zealand, and South Korea are all posting losses this week.
-
Inflation back in focus: Markets are once again pricing in the risk that elevated energy costs could undermine the outlook for global bonds, which had previously recorded their strongest start to a year since the pandemic.
-
Trump comments on the Iran conflict: The former US president stated that the largest US strike may still be ahead, did not rule out a ground operation, and emphasized that with current military capabilities and industrial strength, the US could sustain a prolonged and ultimately victorious war.
-
TTF futures jumps: futures on European natural gas TTF surges more than 20% today after yesterday almost 50% jump driven by supply halt in Qatar.
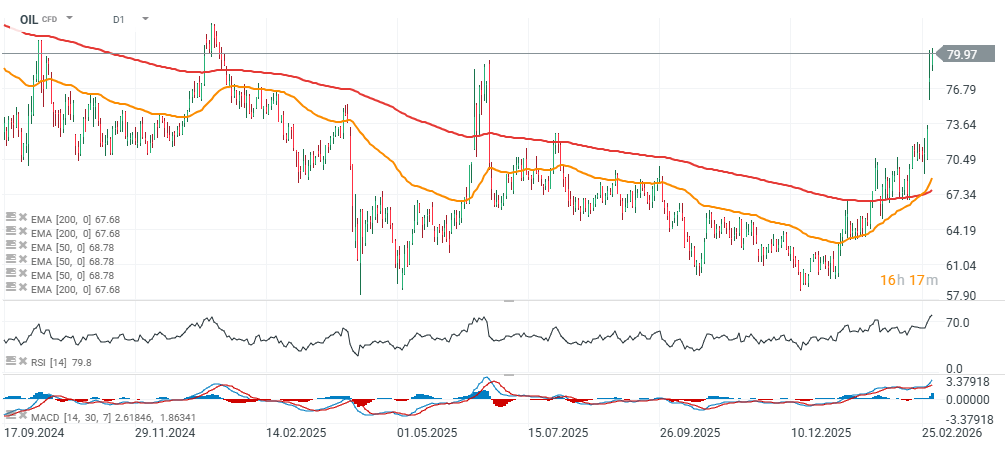
OIL (D1 timeframe)
Looking at the Brent crude futures chart, we can see that the EMA200 and EMA50 have formed a technical “golden cross,” which may signal a more sustained bullish impulse, as the 50-period moving average has crossed above the 200-period average from below.
Source: xStation5

Economic calendar: Eurozone CPI and central bankers speeches in focus

Daily summary: Markets aren’t afraid of the conflict, valuations are normalizing

US OPEN: War in Iran hits the markets

BREAKING: US Manufacturing data above expectations! 📈🏭
This content has been created by XTB S.A. This service is provided by XTB S.A., with its registered office in Warsaw, at Prosta 67, 00-838 Warsaw, Poland, entered in the register of entrepreneurs of the National Court Register (Krajowy Rejestr Sądowy) conducted by District Court for the Capital City of Warsaw, XII Commercial Division of the National Court Register under KRS number 0000217580, REGON number 015803782 and Tax Identification Number (NIP) 527-24-43-955, with the fully paid up share capital in the amount of PLN 5.869.181,75. XTB S.A. conducts brokerage activities on the basis of the license granted by Polish Securities and Exchange Commission on 8th November 2005 No. DDM-M-4021-57-1/2005 and is supervised by Polish Supervision Authority.