


- European and Asian indices fell sharply amid a weak start to the US tech earnings season.
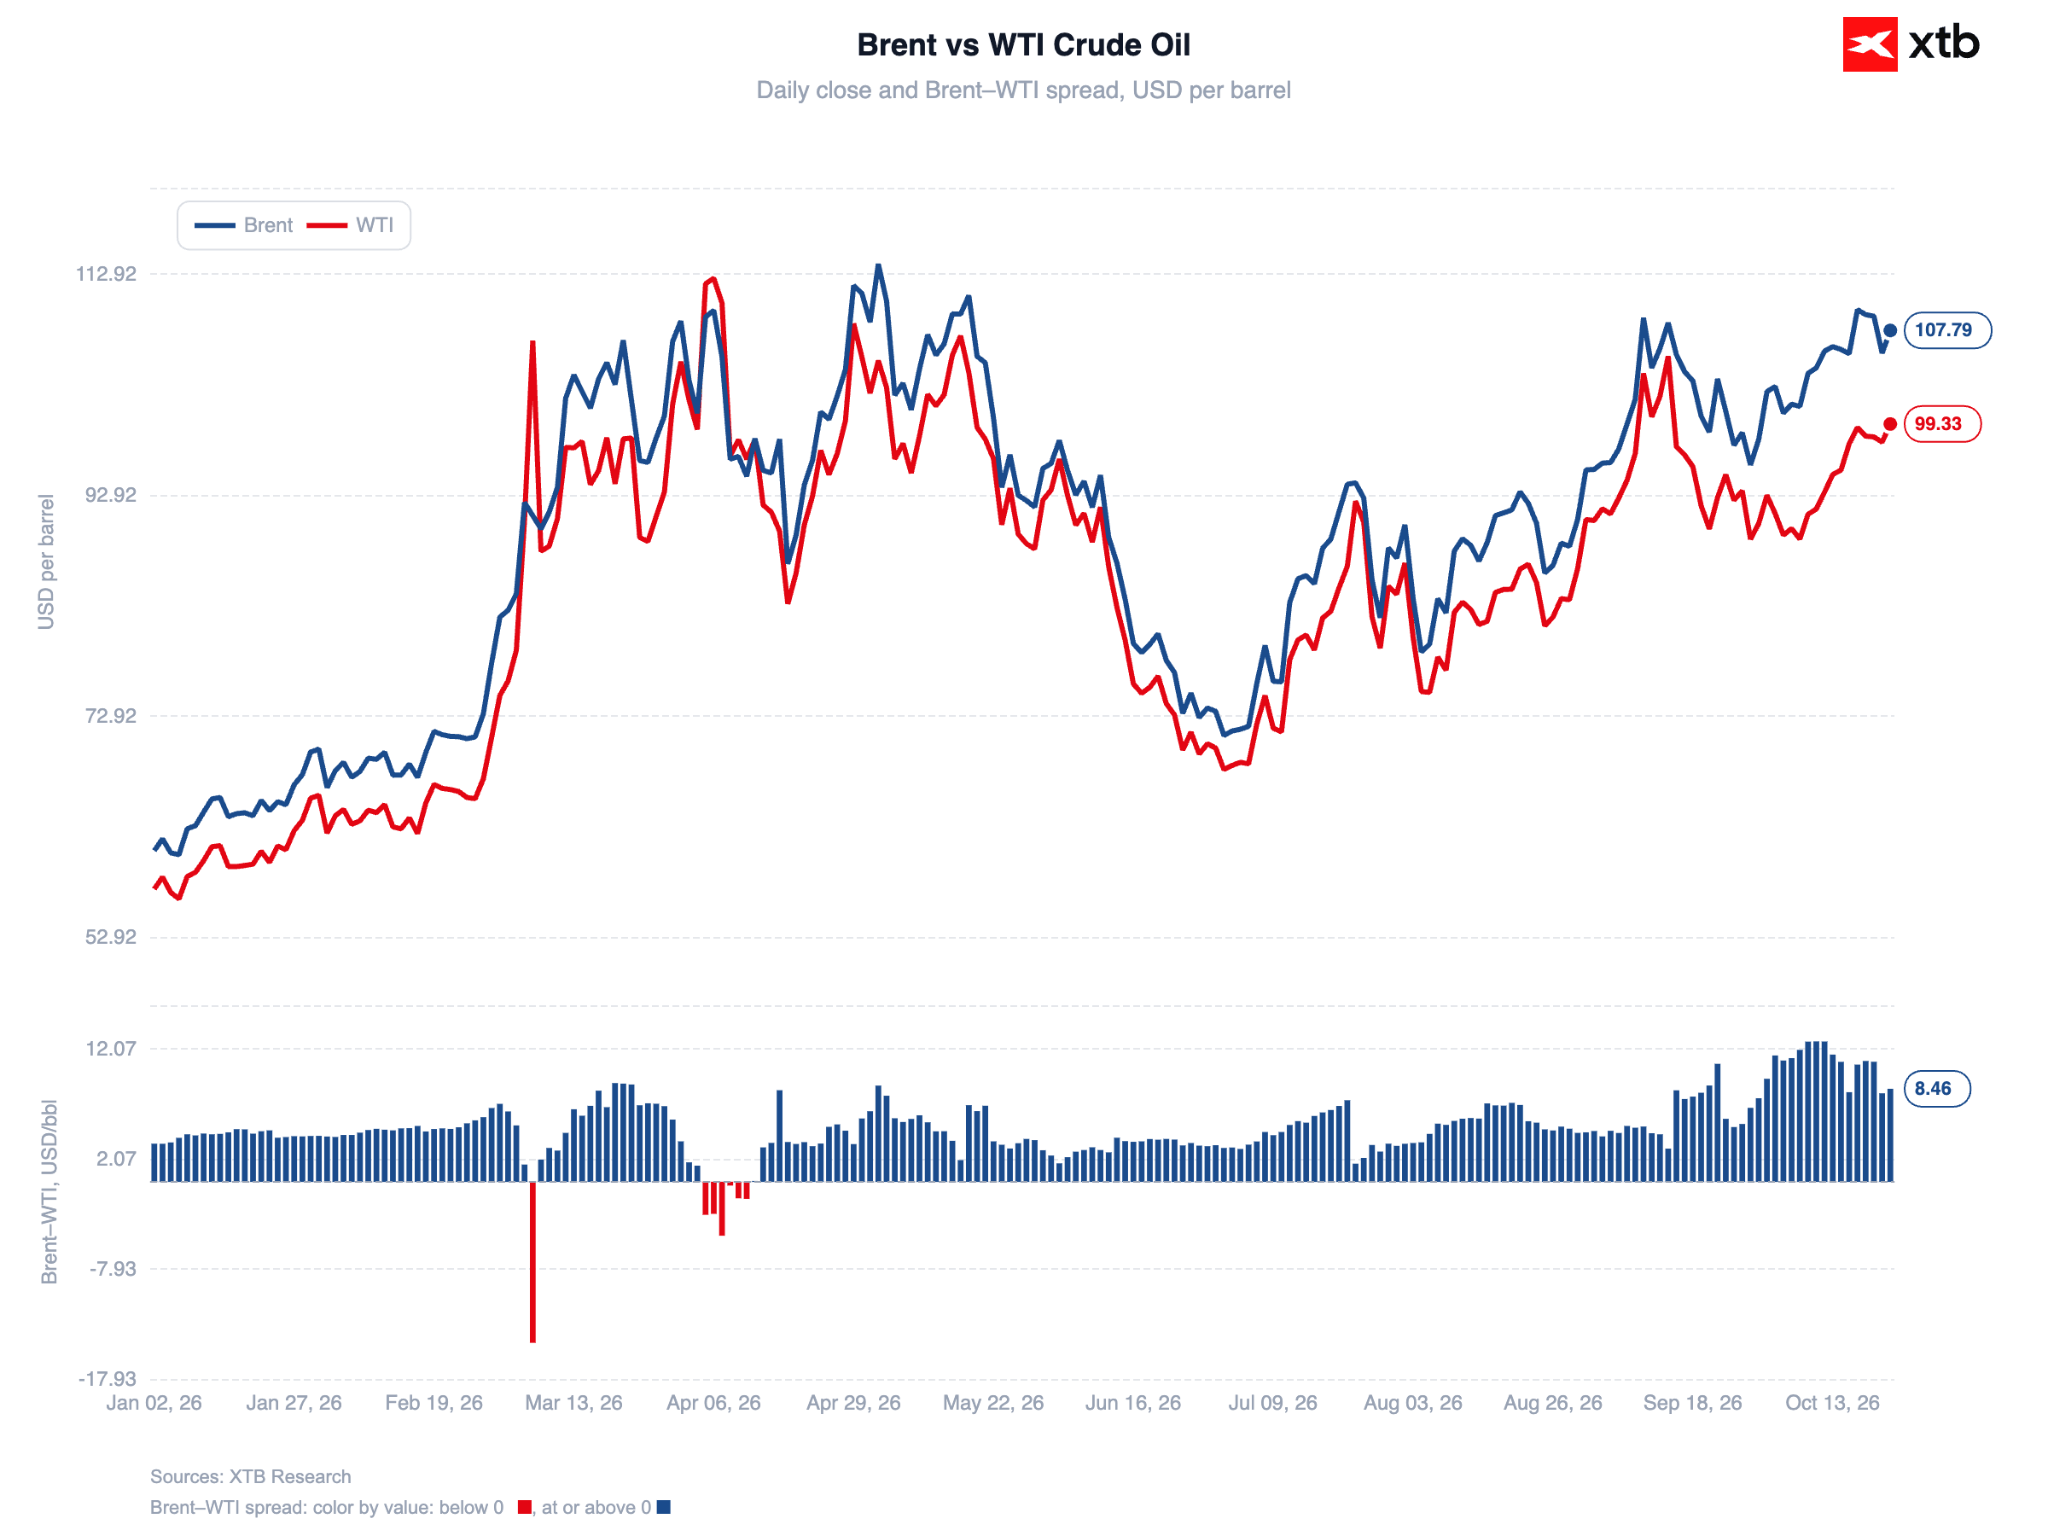
- Brent crude surpassed 108 USD per barrel following infrastructure attacks in Saudi Arabia.
- US Treasuries rallied and safe-haven currencies strengthened as investors exited risk assets.
- Gold and cryptocurrencies declined despite rising geopolitical tensions in the Middle East.
Two key themes are dominating markets today. The first is a relatively disappointing start to earnings season in the US technology sector. The second is a sharp surge in crude oil prices following an escalation in the Middle East.
Capital has not sought refuge in gold, however; instead, it has fled towards bonds and traditional safe havens such as the Swiss franc and Japanese yen.
Indices
Europe is firmly in the red today. Germany's DAX has shed 1.2%, while the French CAC40 is down 1.6%. Performance is even weaker across the pan-European Euro Stoxx 50 and Spain's IBEX 35 (both down 1.8%), as well as Italy's FTSE MIB (-2%).
Figure 1: Gainers and Losers in Euro Stoxx 50 (22.10.2026)
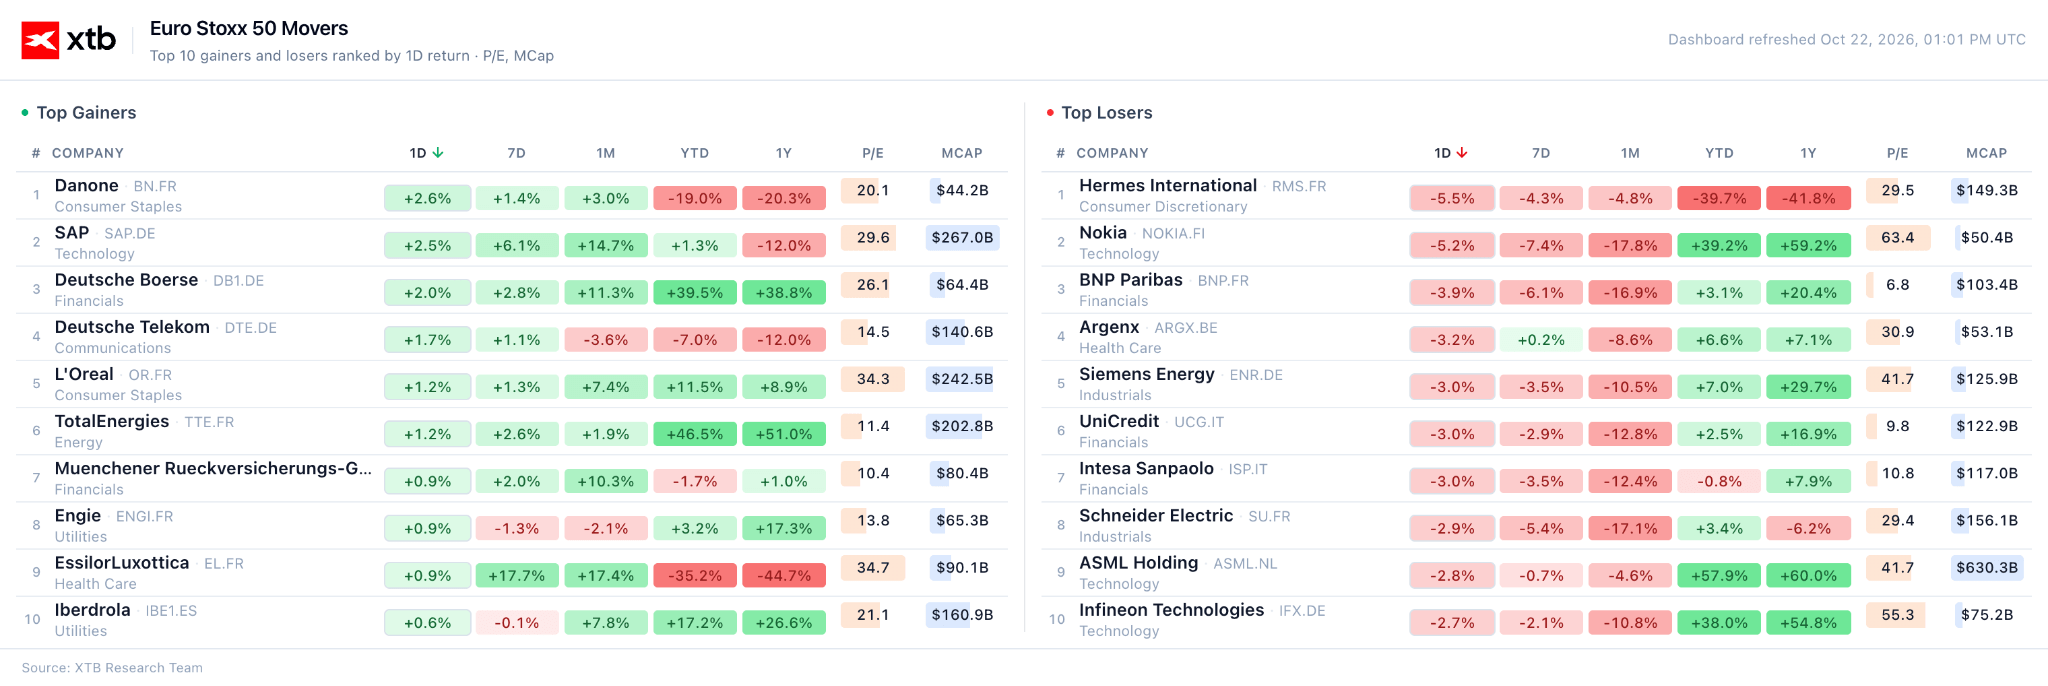 Source: XTB Research, 22.10.2026
Even steeper losses were recorded across Asian indices. Japan's Nikkei 225 dropped 2.7%, while South Korea's KOSPI, heavily weighted towards memory chipmakers, fell 3.5% to close at its lowest level since April.
Figure 2: Nikkei 225 (21.09.2026 - 22.10.2026)
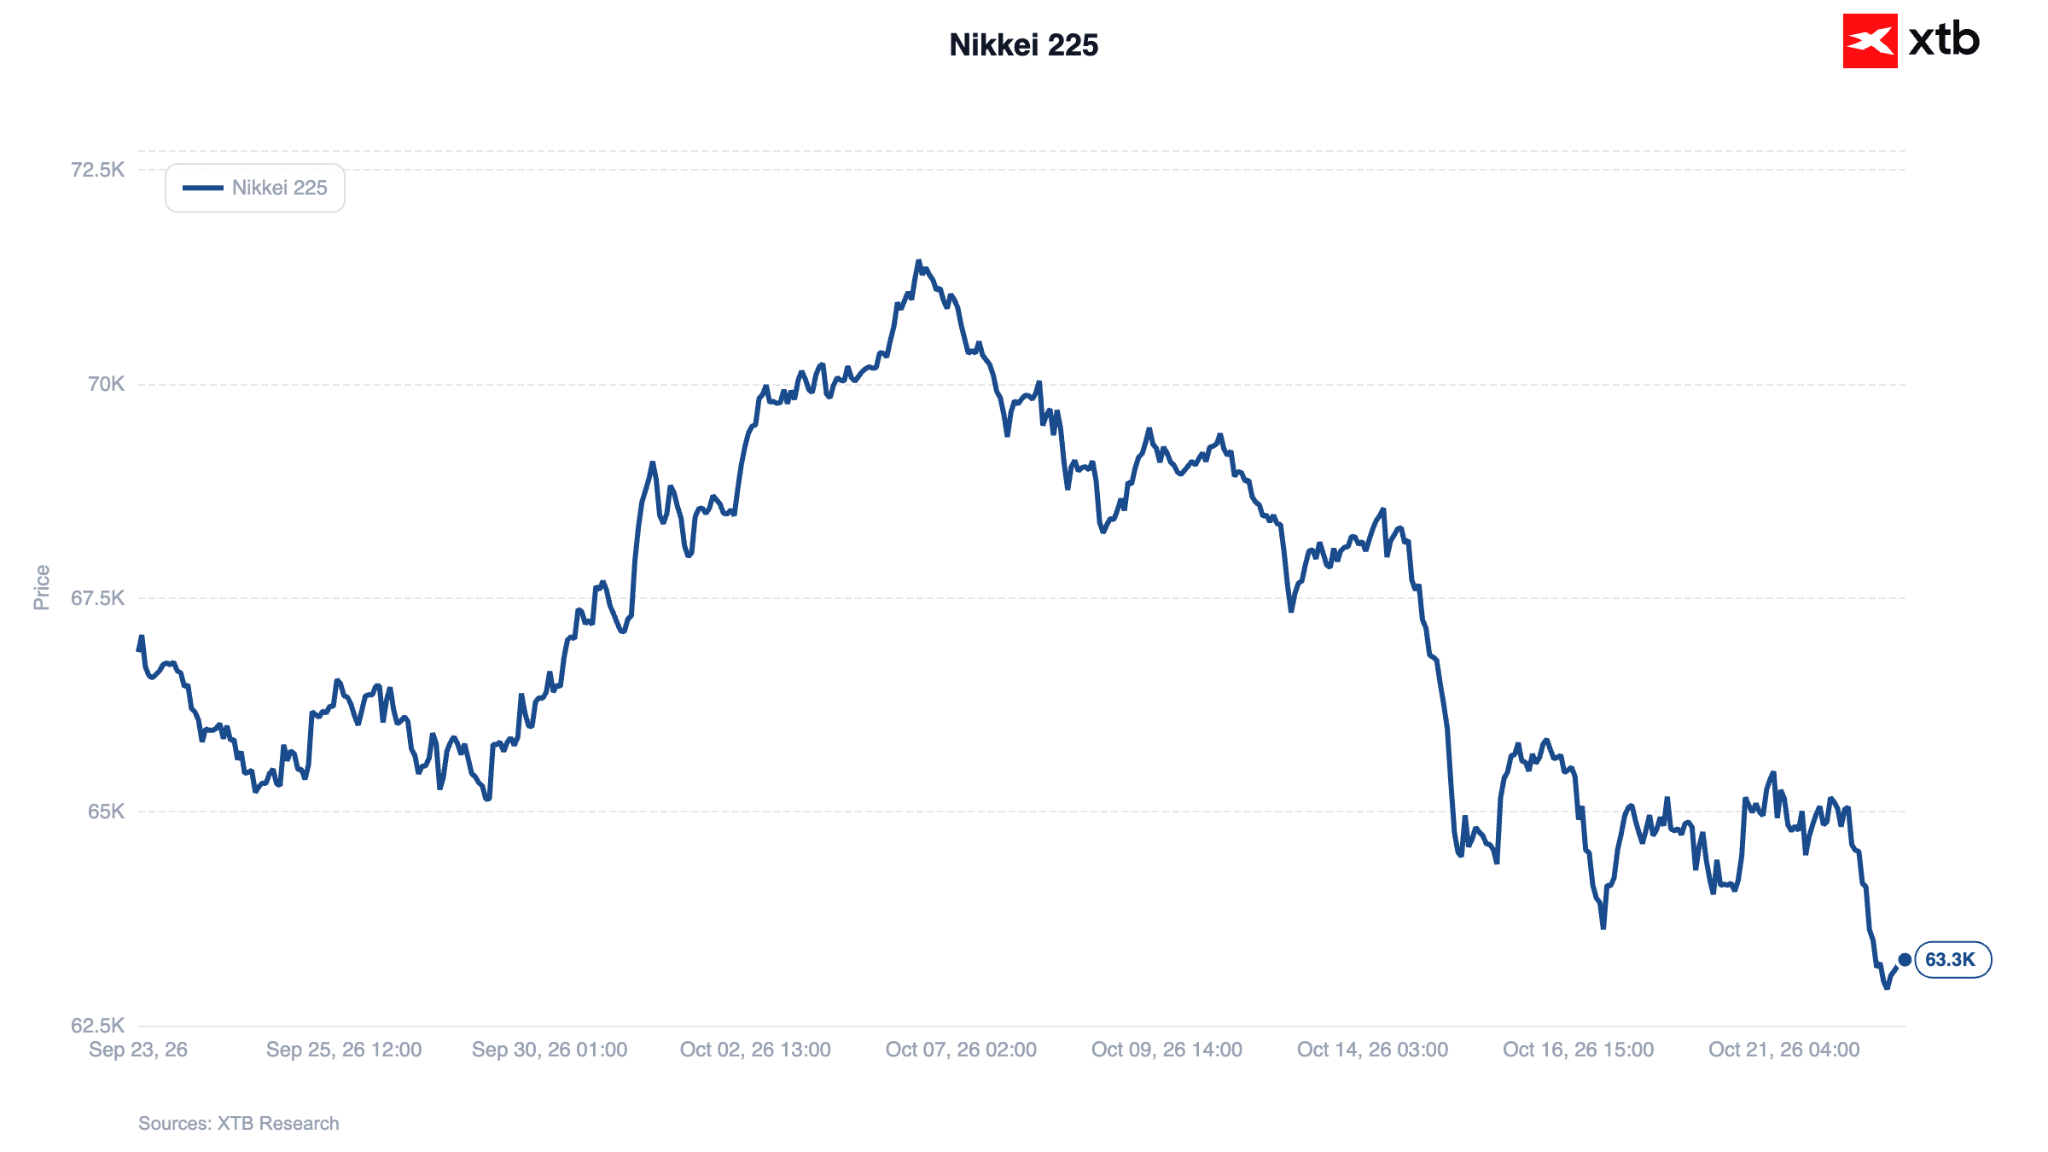 Source: XTB Research, 22.10.2026
Futures on the Nasdaq 100 are trading nearly 1.7% lower, extending a sell-off that began last week when the index dropped 5.5% in its sharpest weekly decline since April 2025 following the notorious Liberation Day tariff announcements by President Trump.
Stocks
Today's market decline cannot be attributed to a single catalyst, which is perhaps the most significant observation. Following Q3 earnings releases, several major tech stocks are posting sharp pre-market losses, each driven by distinct corporate factors.
Lam Research, the semiconductor equipment maker, issued adjusted profit guidance for the upcoming quarter that missed expectations by a narrow margin. Despite the modest shortfall, the stock plummeted nearly 8% in pre-market trading, dragging down the wider semiconductor equipment peer group (Applied Materials, KLA, and Ultra Clean all shed over 4%).
Figure 3: Dashboard for Lam Research (2021 - 2026)
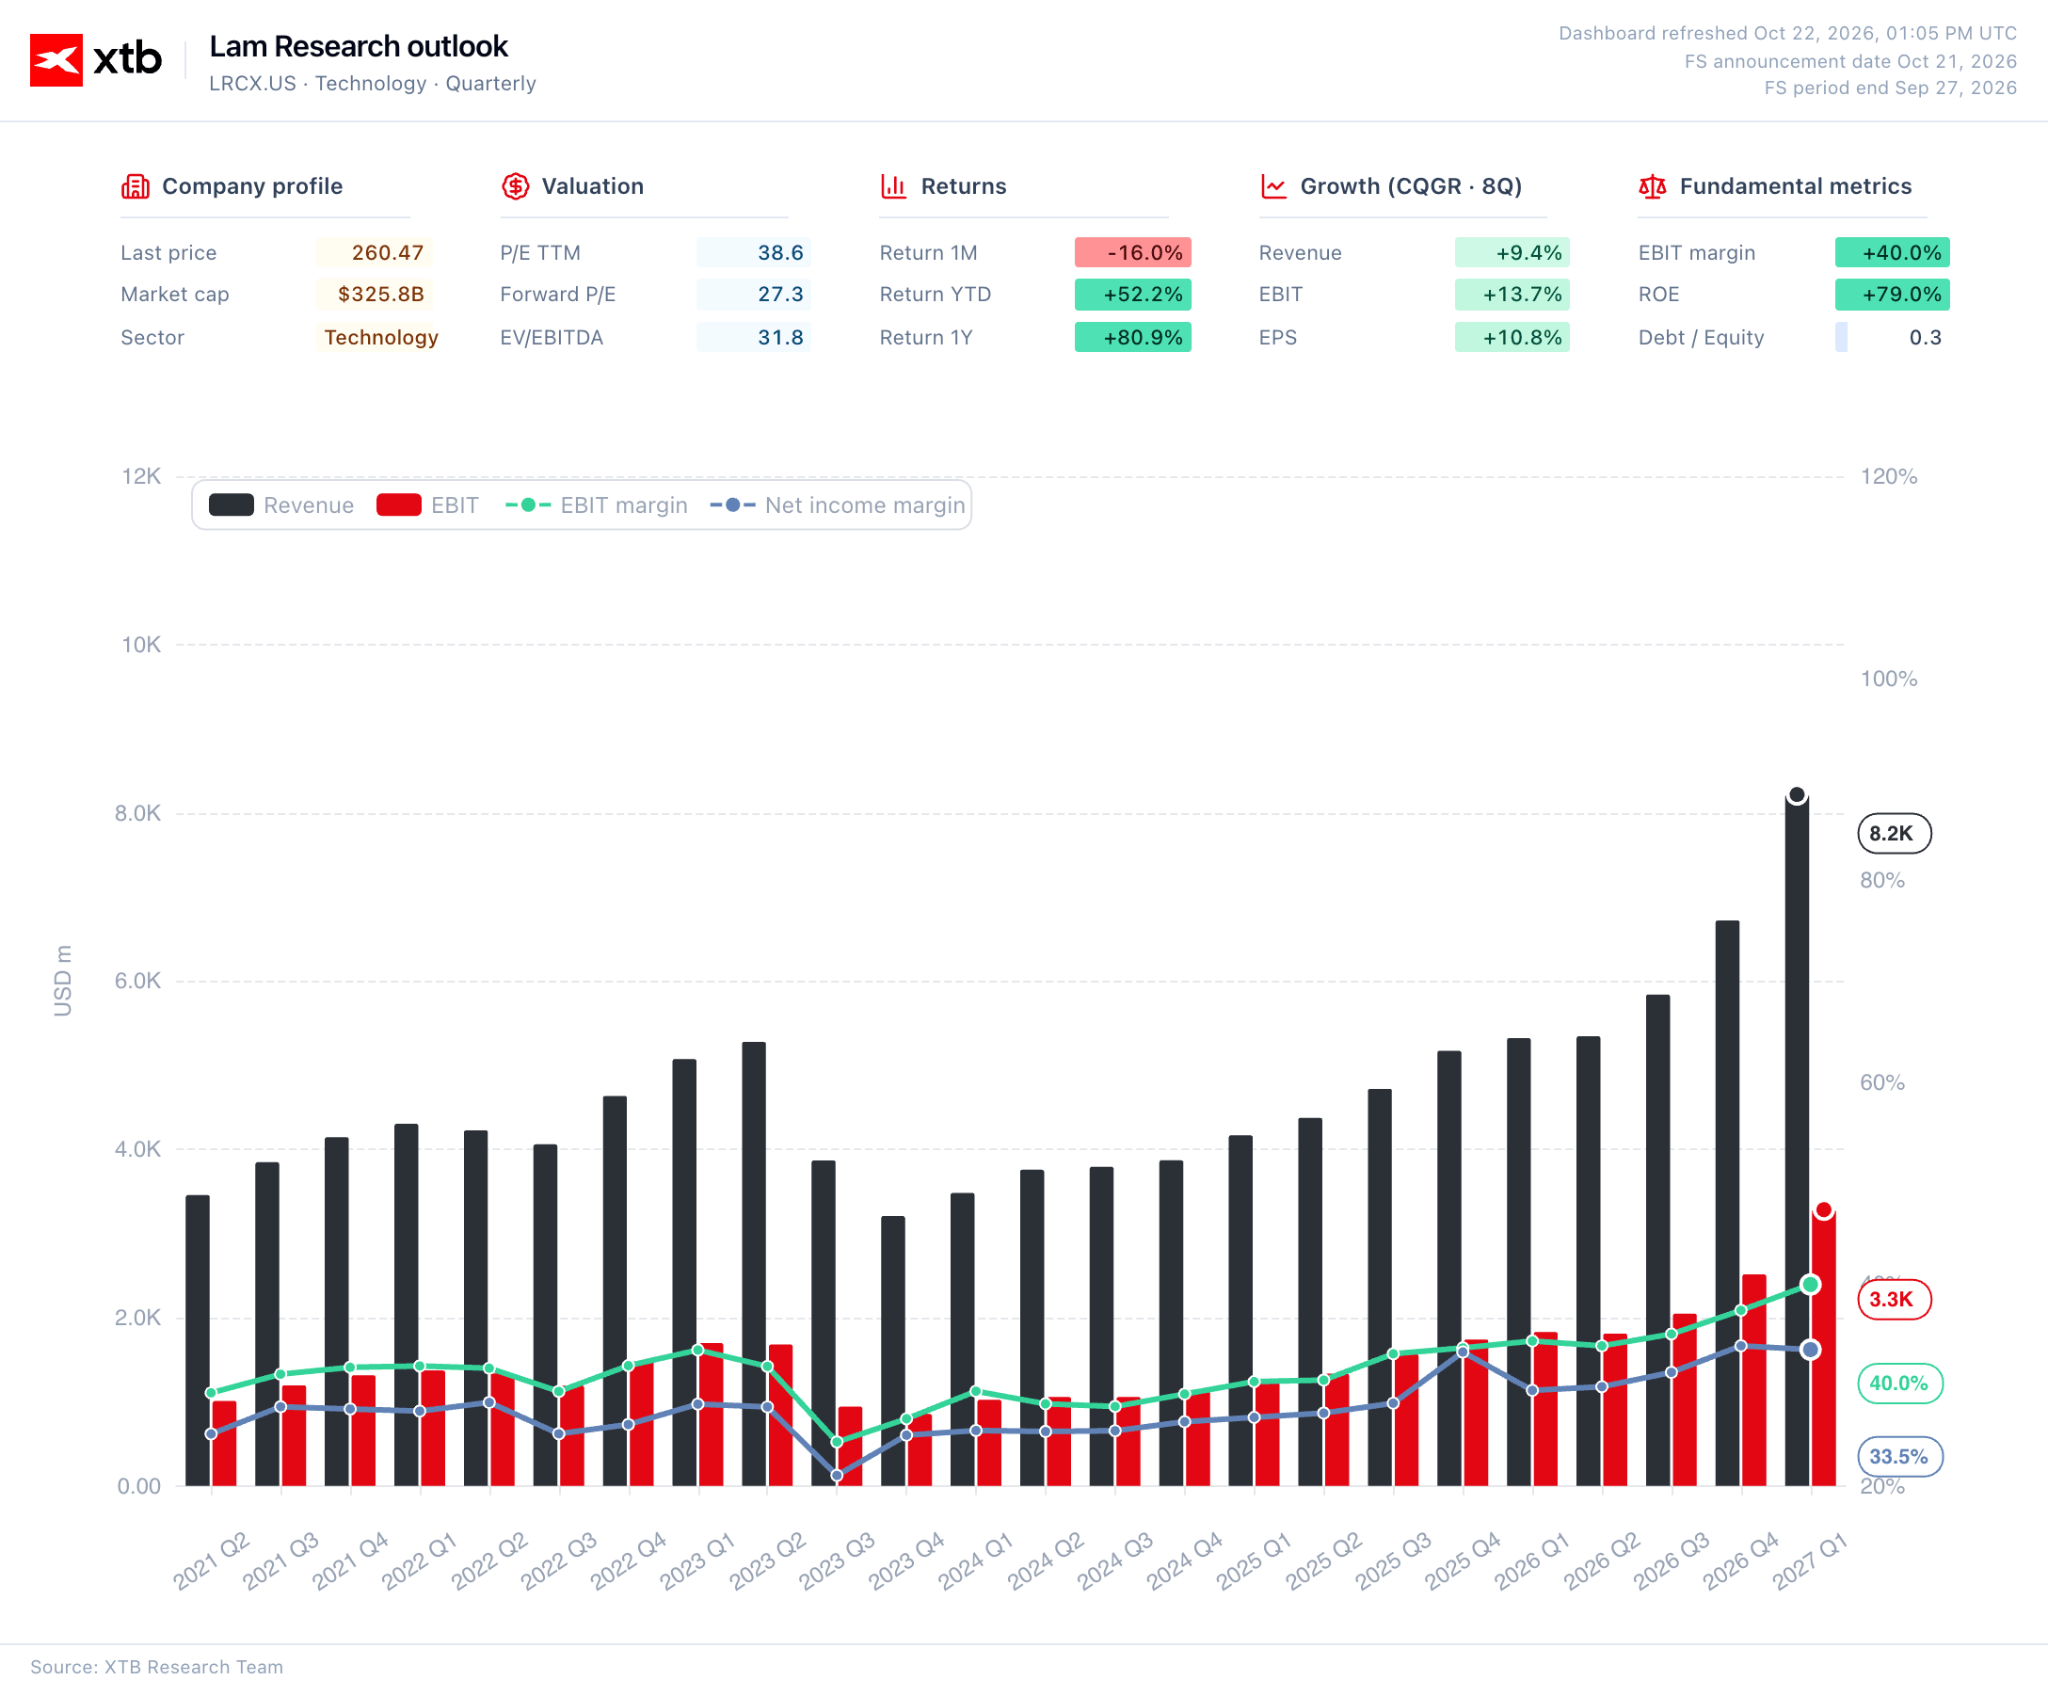 Source: XTB Research, 22.10.2026
Tesla (-4%) reported respectable figures, but investor sentiment was dampened by the decision to trim its full-year capital expenditure target to around $20 billion. Markets, which price the stock as an AI and robotics enterprise, likely interpreted the reduction as a signal of tempered ambition.
Figure 4: Dashboard for Tesla (2020 - 2026)
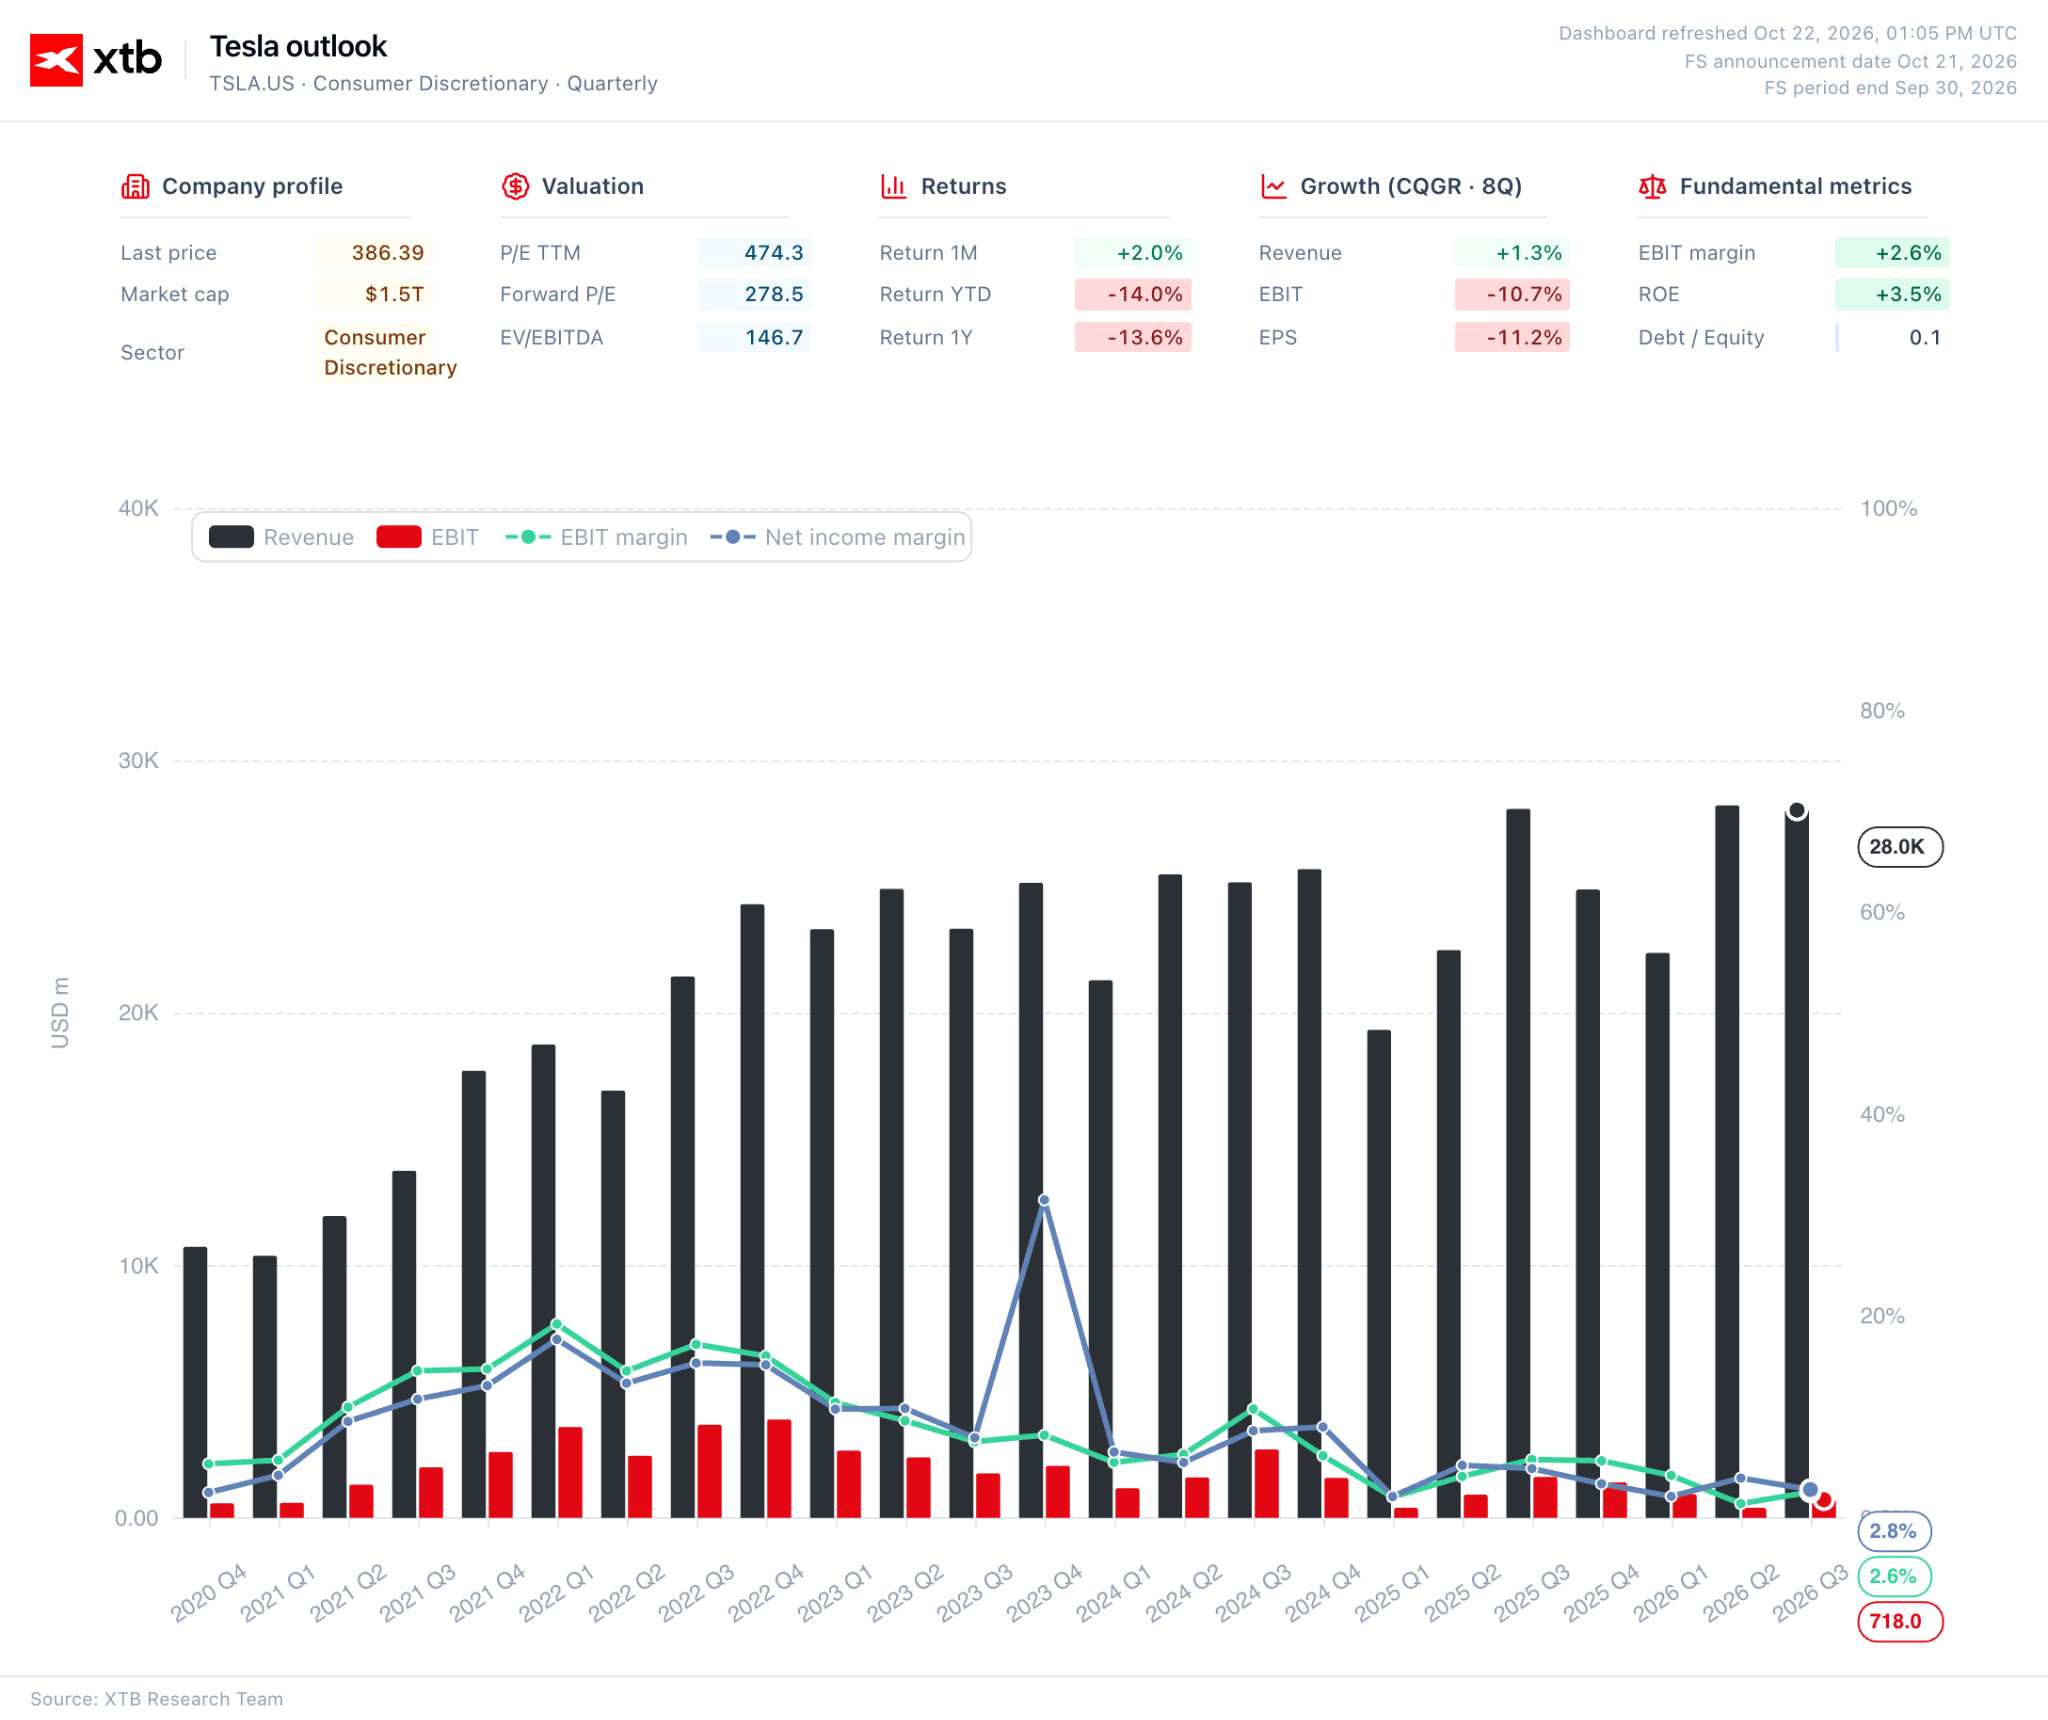 Source: XTB Research, 22.10.2026
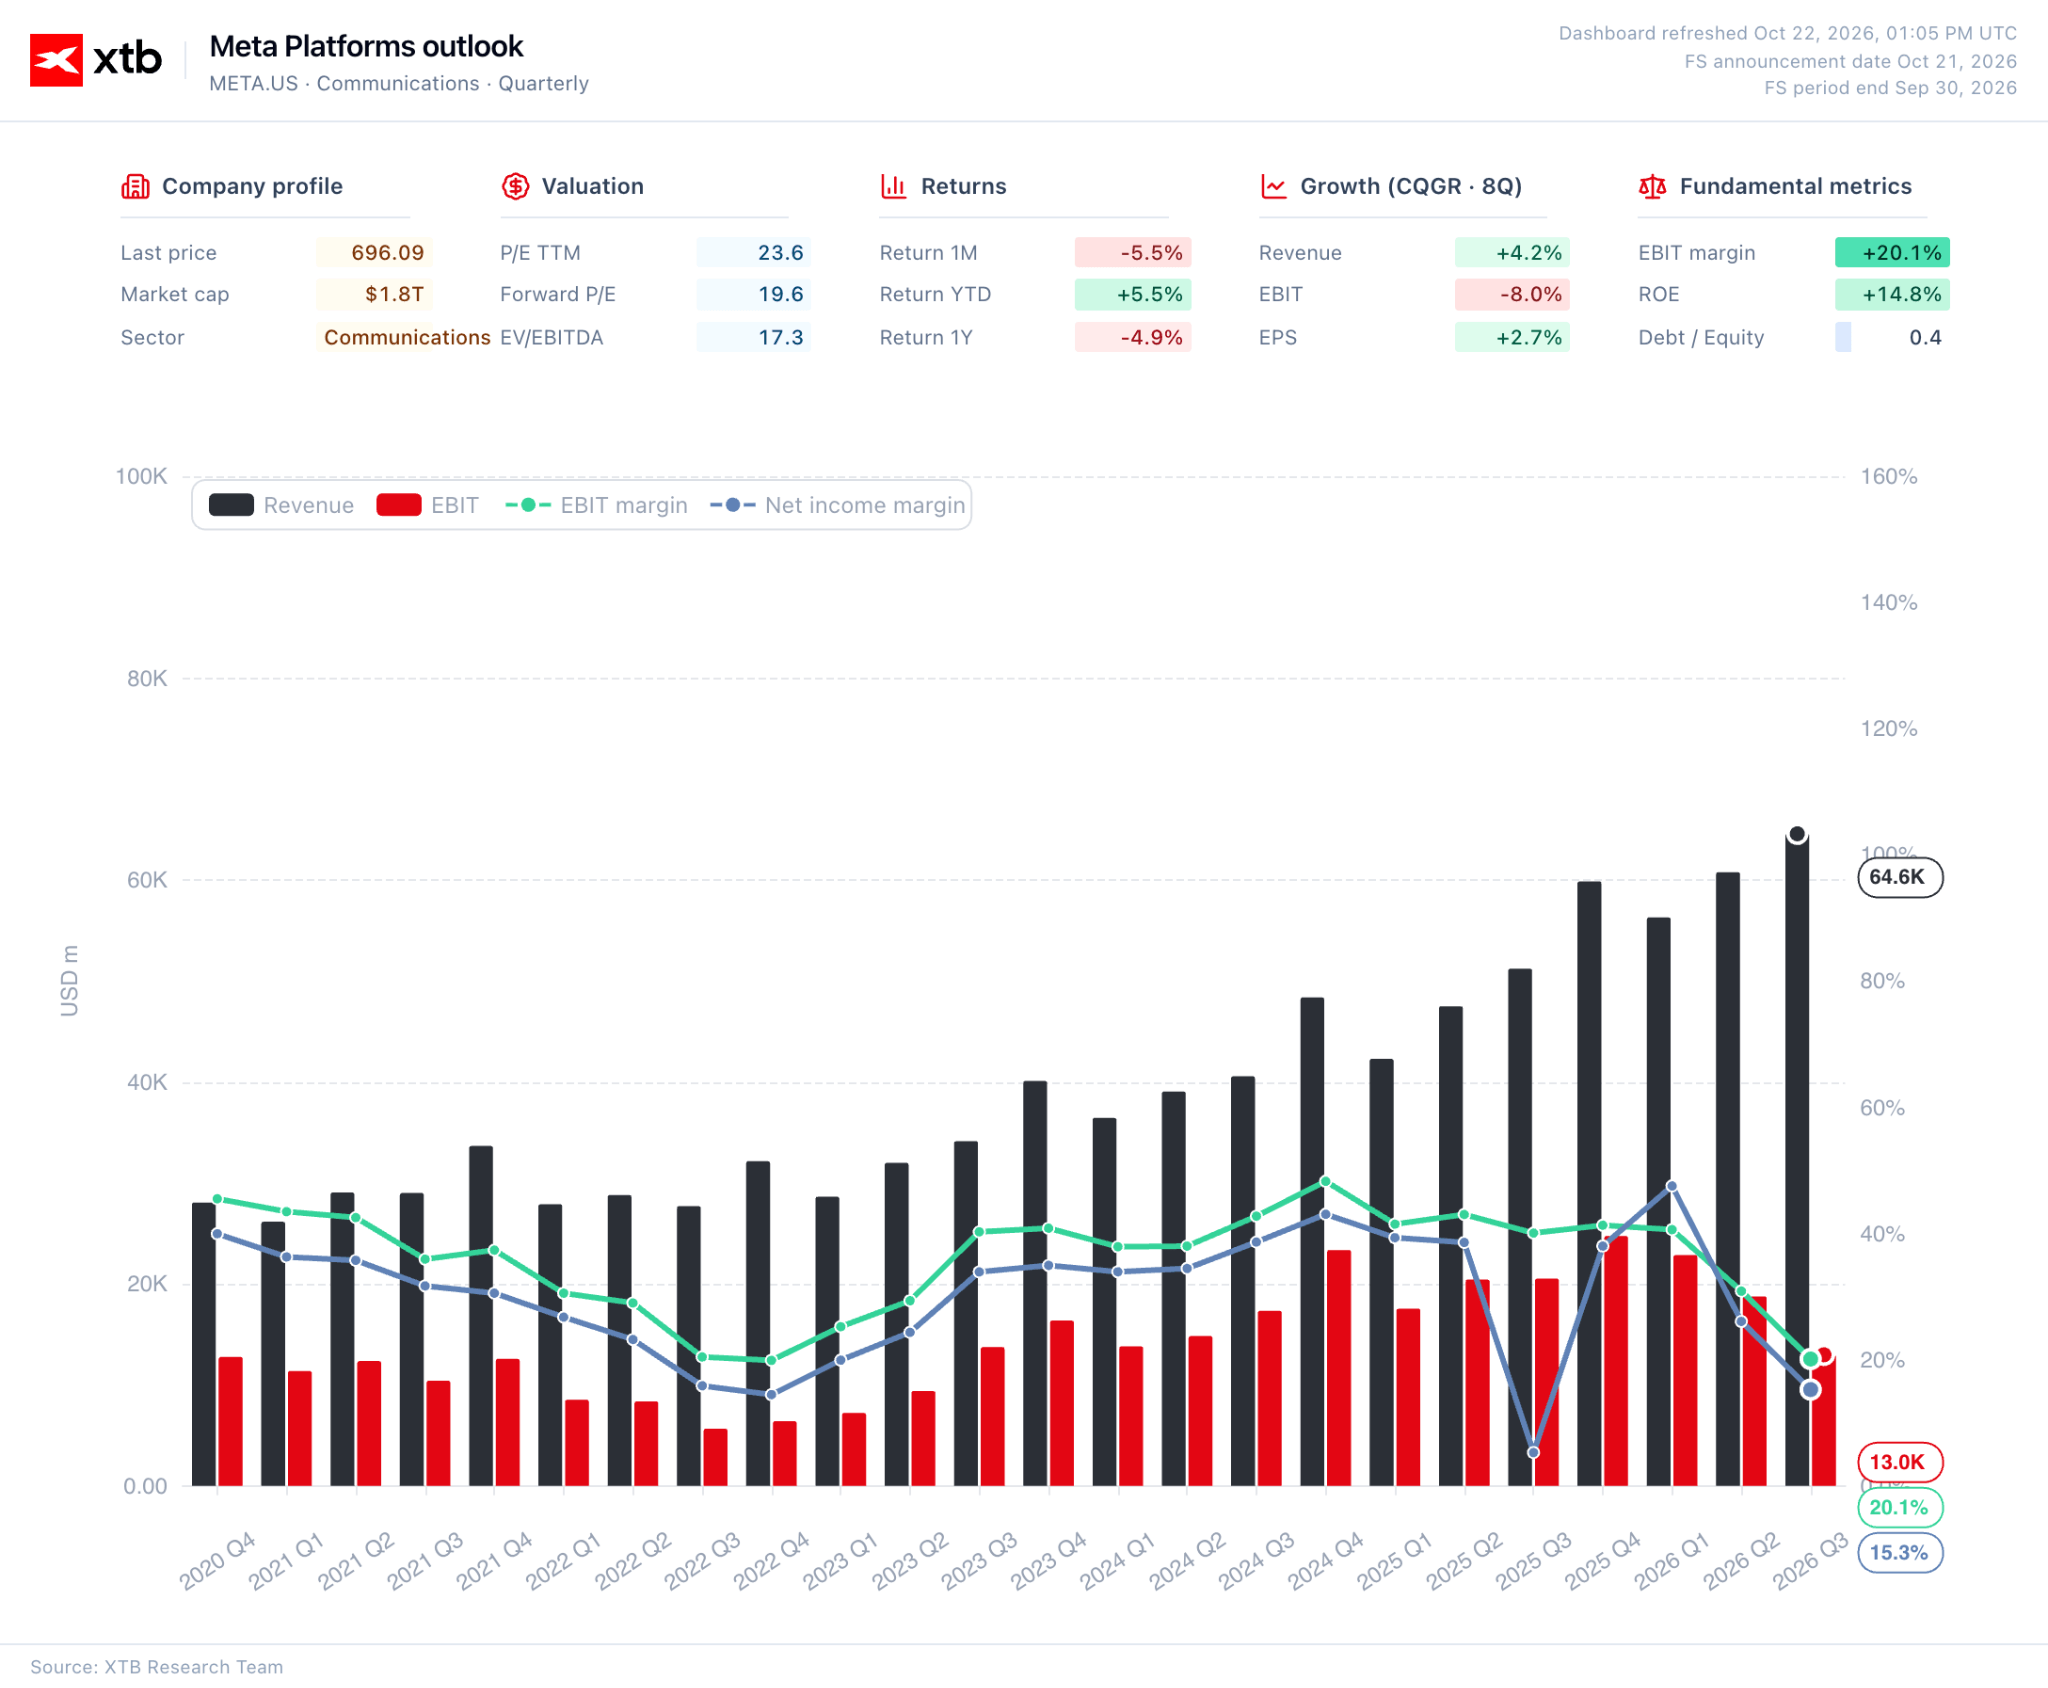
Meta, despite delivering a solid quarter, faces the opposite issue. Results failed to reassure investors unsettled by plans for continued, aggressive spending expansion. CEO Mark Zuckerberg's assertions that AI investments are starting to pay off failed to convince the market. Higher capital expenditure compresses free cash flow, and unlike Microsoft, Amazon, or Google, Meta does not monetise compute capacity directly to third parties, making return on investment harder to demonstrate.
Figure 5: Dashboard for Meta (2020 - 2026)
 Source: XTB Research, 22.10.2026
Investors entered earnings season with an explicitly defensive bias, penalising almost any report that fails to meet elevated expectations across every metric. Unease is further heightened by market positioning, with global short exposure among hedge funds reaching five-year highs (a structure that could trigger a violent short squeeze in the event of a broad market rally).
Commodities
The second major narrative of the day is crude oil. Brent crude is up 2.5%, breaking above $111 per barrel to reach its highest level since May (contract for January, visible in the XTB platform, is on $108). US WTI crude (+2.2%) hovered near the key $100 mark. The immediate catalyst was attacks on infrastructure in Saudi Arabia, which heightened concerns over supply continuity from the region. Illustrating the degree of concern, Saudi Aramco is reportedly seeking access to international strategic storage facilities to safeguard delivery capabilities against potential local disruptions.
Figure 6: Brent and WTI Crude Oil (2026)
 Source: XTB Research, 22.10.2026
Geopolitics
Following the strikes in Saudi Arabia, Washington ordered non-essential diplomatic staff and dependents to depart the kingdom. The US and Israel are reportedly preparing contingency plans for potential further strikes on targets in Iran. Markets are currently pricing in the tail risk of escalation surrounding the Strait of Hormuz rather than immediate physical disruption alone.
Tensions remain elevated closer to home as well: Paris police prohibited demonstrations across key central districts (including areas surrounding the presidential palace and Champs-Élysées) on Thursday, fearing a repeat of weekend unrest that saw over half a million people take to the streets.
Fixed income
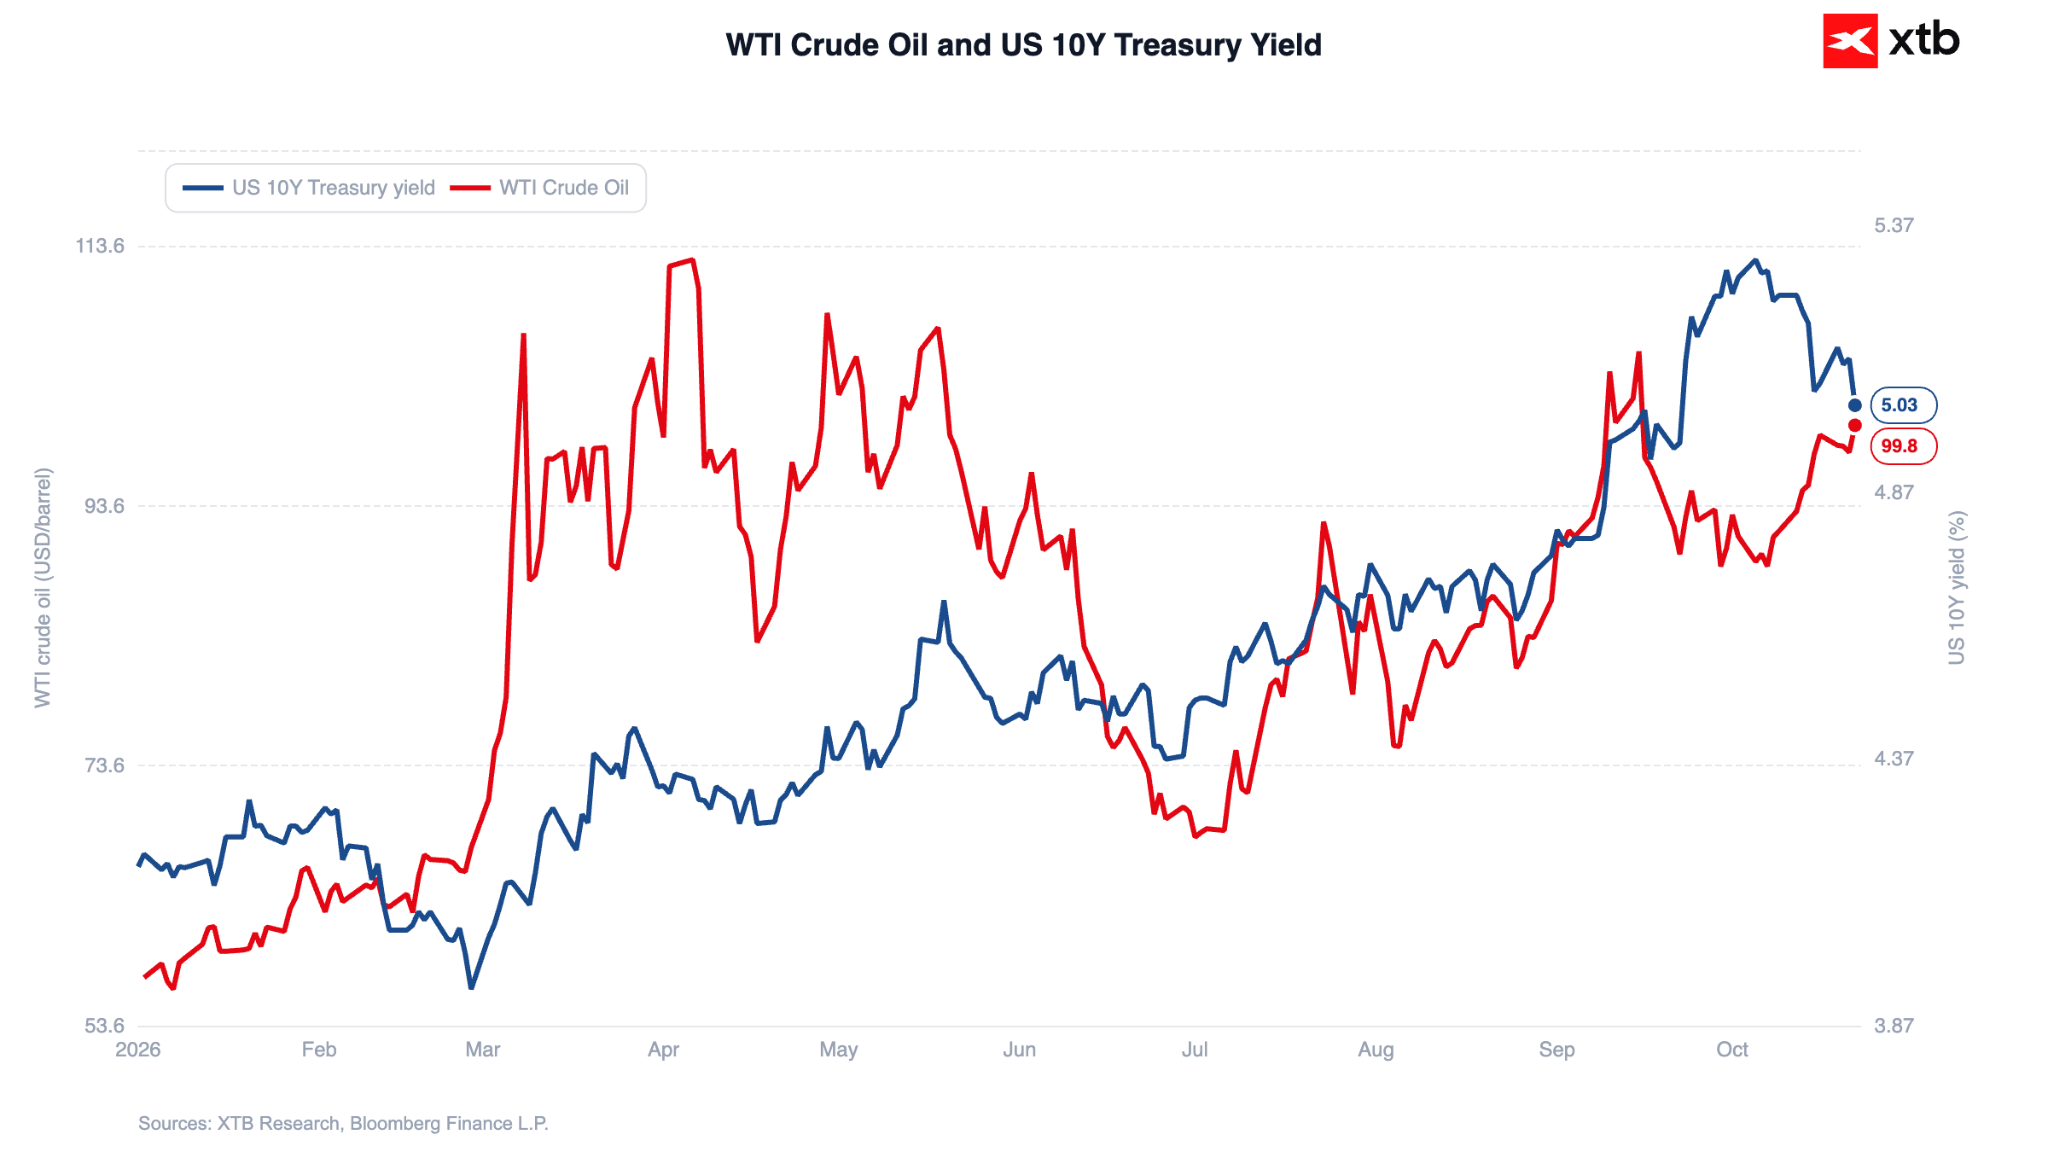
Under normal conditions, rising oil prices push up inflation expectations and lift sovereign bond yields, a dynamic observed in recent sessions. Today, however, the relationship inverted: US Treasuries rallied sharply, driving the 10-year yield down around 9 basis points towards 5.04%, while 30-year yields dropped to a one-month low near 5.35%.
Figure 7: WTI Crude Oil and US 10Y Treasury Yield (2026)
 Source: XTB Research, 22.10.2026
Safe-haven demand triggered by the tech sell-off ultimately overwhelmed inflationary concerns stemming from higher energy prices.
Foreign exchange
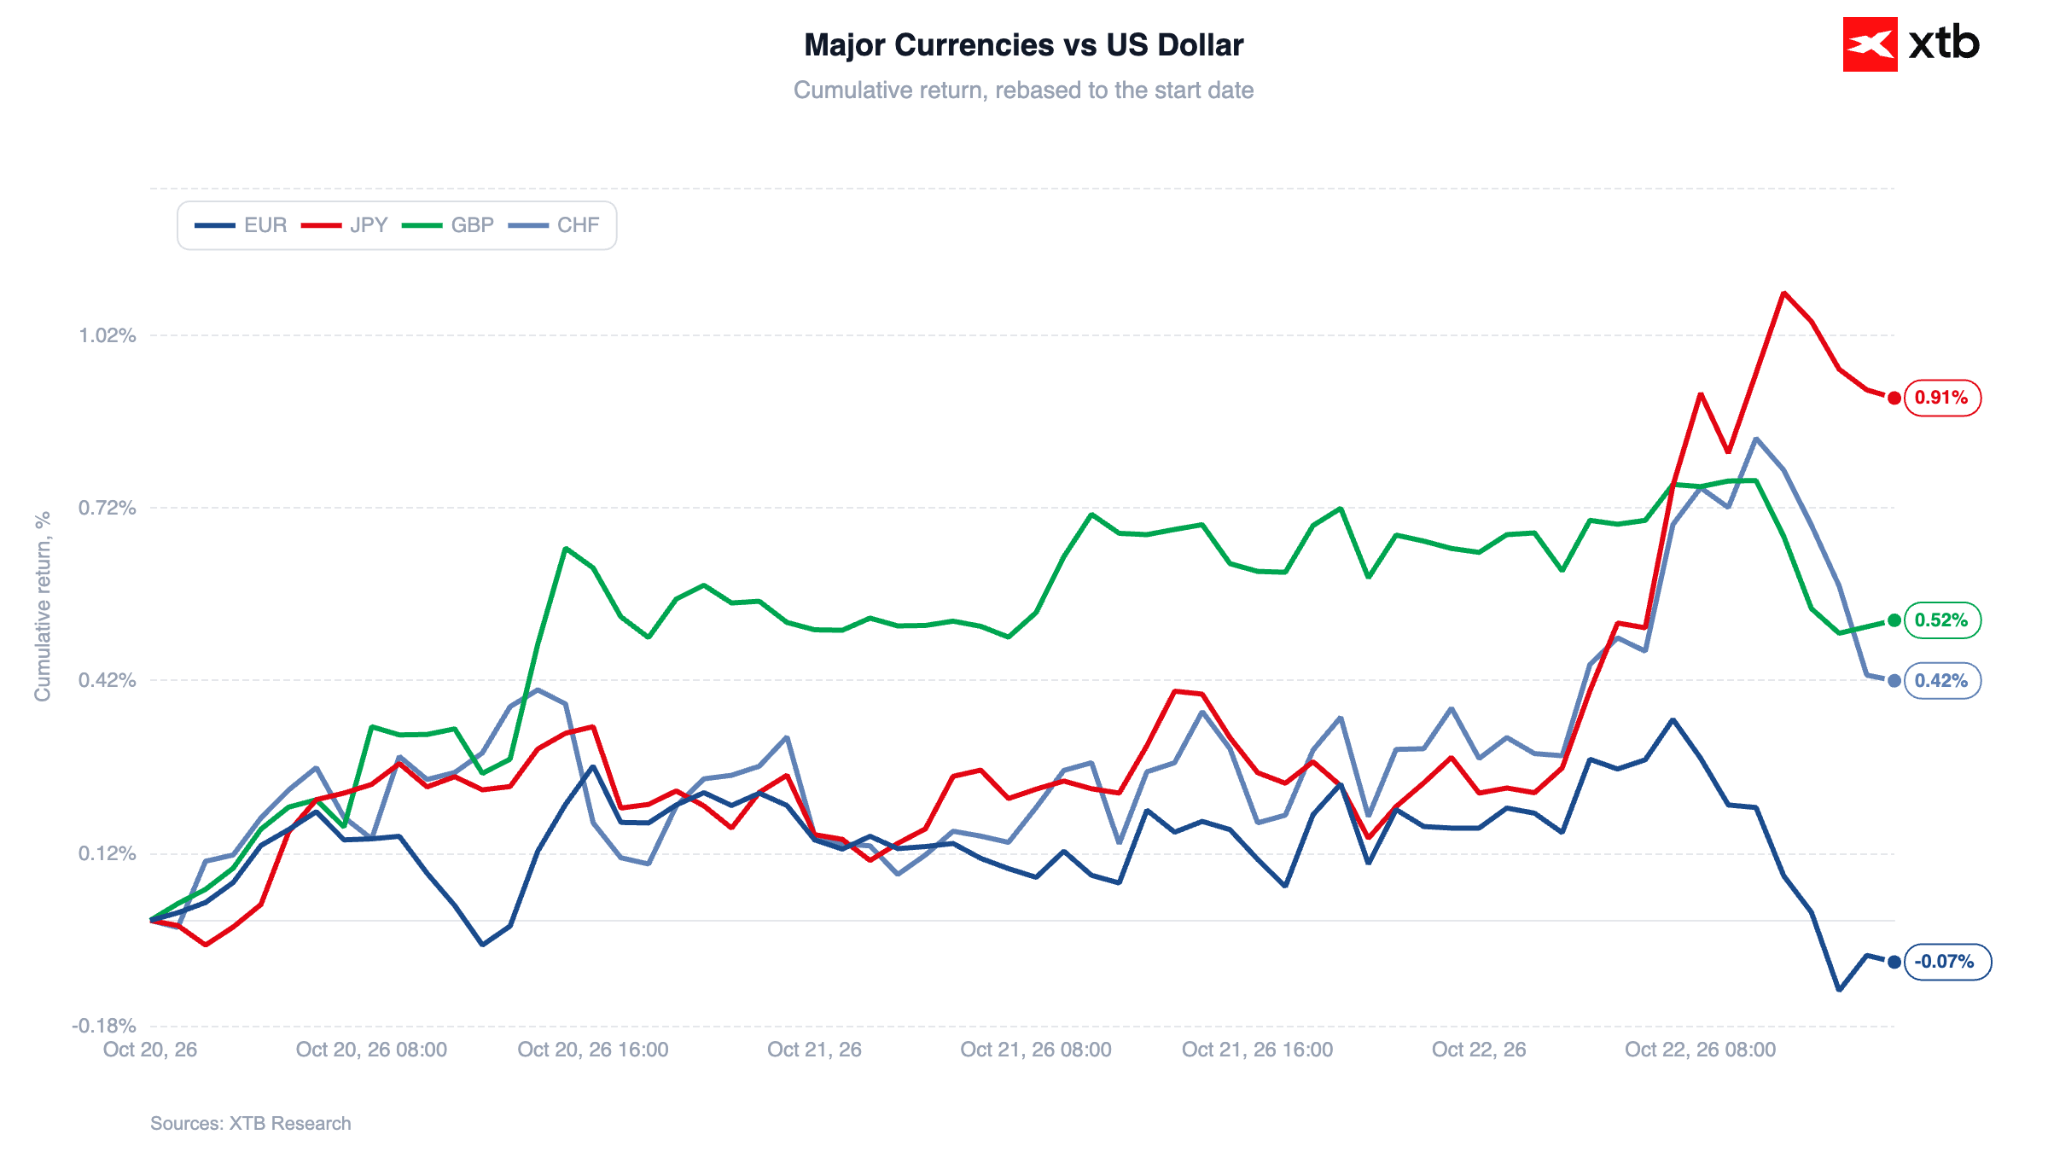
A similar risk-off dynamic dominated currency markets. The Japanese yen appreciated nearly 0.8% against the US dollar, while the Swiss franc gained around 0.4%, both currencies benefitting from capital defensive flows as investors unwound risk assets. Interestingly, this did not translate into broad US dollar strength: the trade-weighted dollar index was virtually unchanged, with EUR/USD holding near 1.122 as falling US yields countered safe-haven demand for the greenback.
Figure 8: Major Currencies vs US Dollar (20.10.2026 - 22.10.2026)
 Source: XTB Research, 22.10.2026
Precious metals
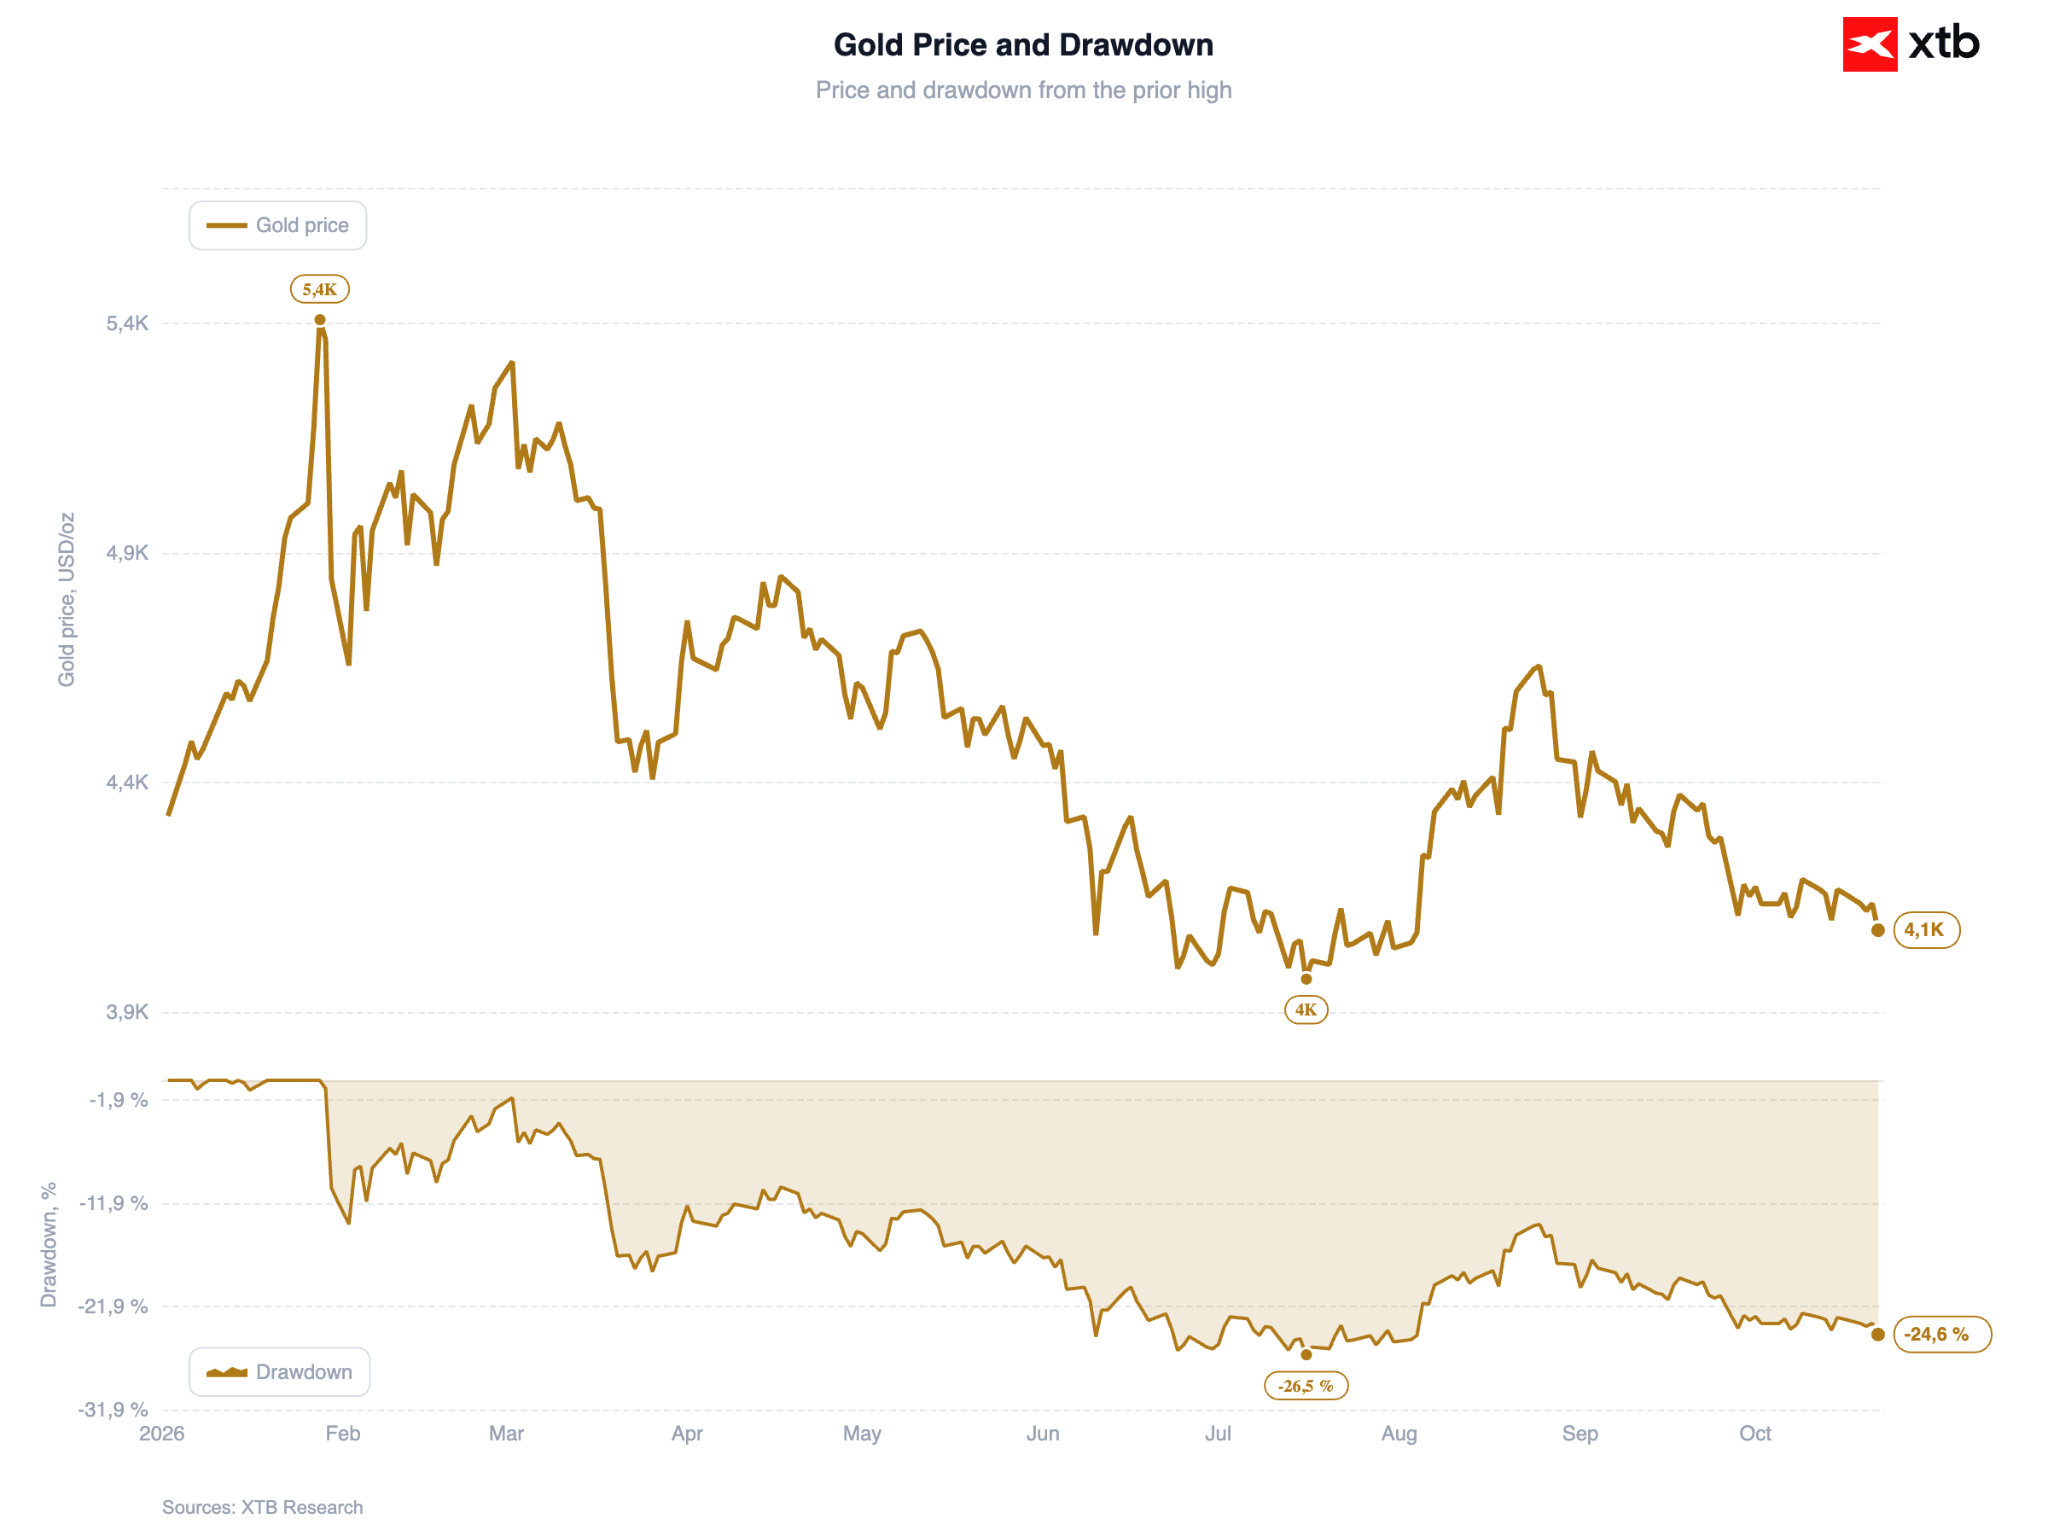
Paradoxically, gold failed to function as a traditional safe haven today. Spot gold dropped 1.3% towards $4,080 per ounce, while silver suffered a sharper decline of 3.5%.
Figure 9: Gold Price (2026)
 Source: XTB Research, 22.10.2026
Cryptocurrencies
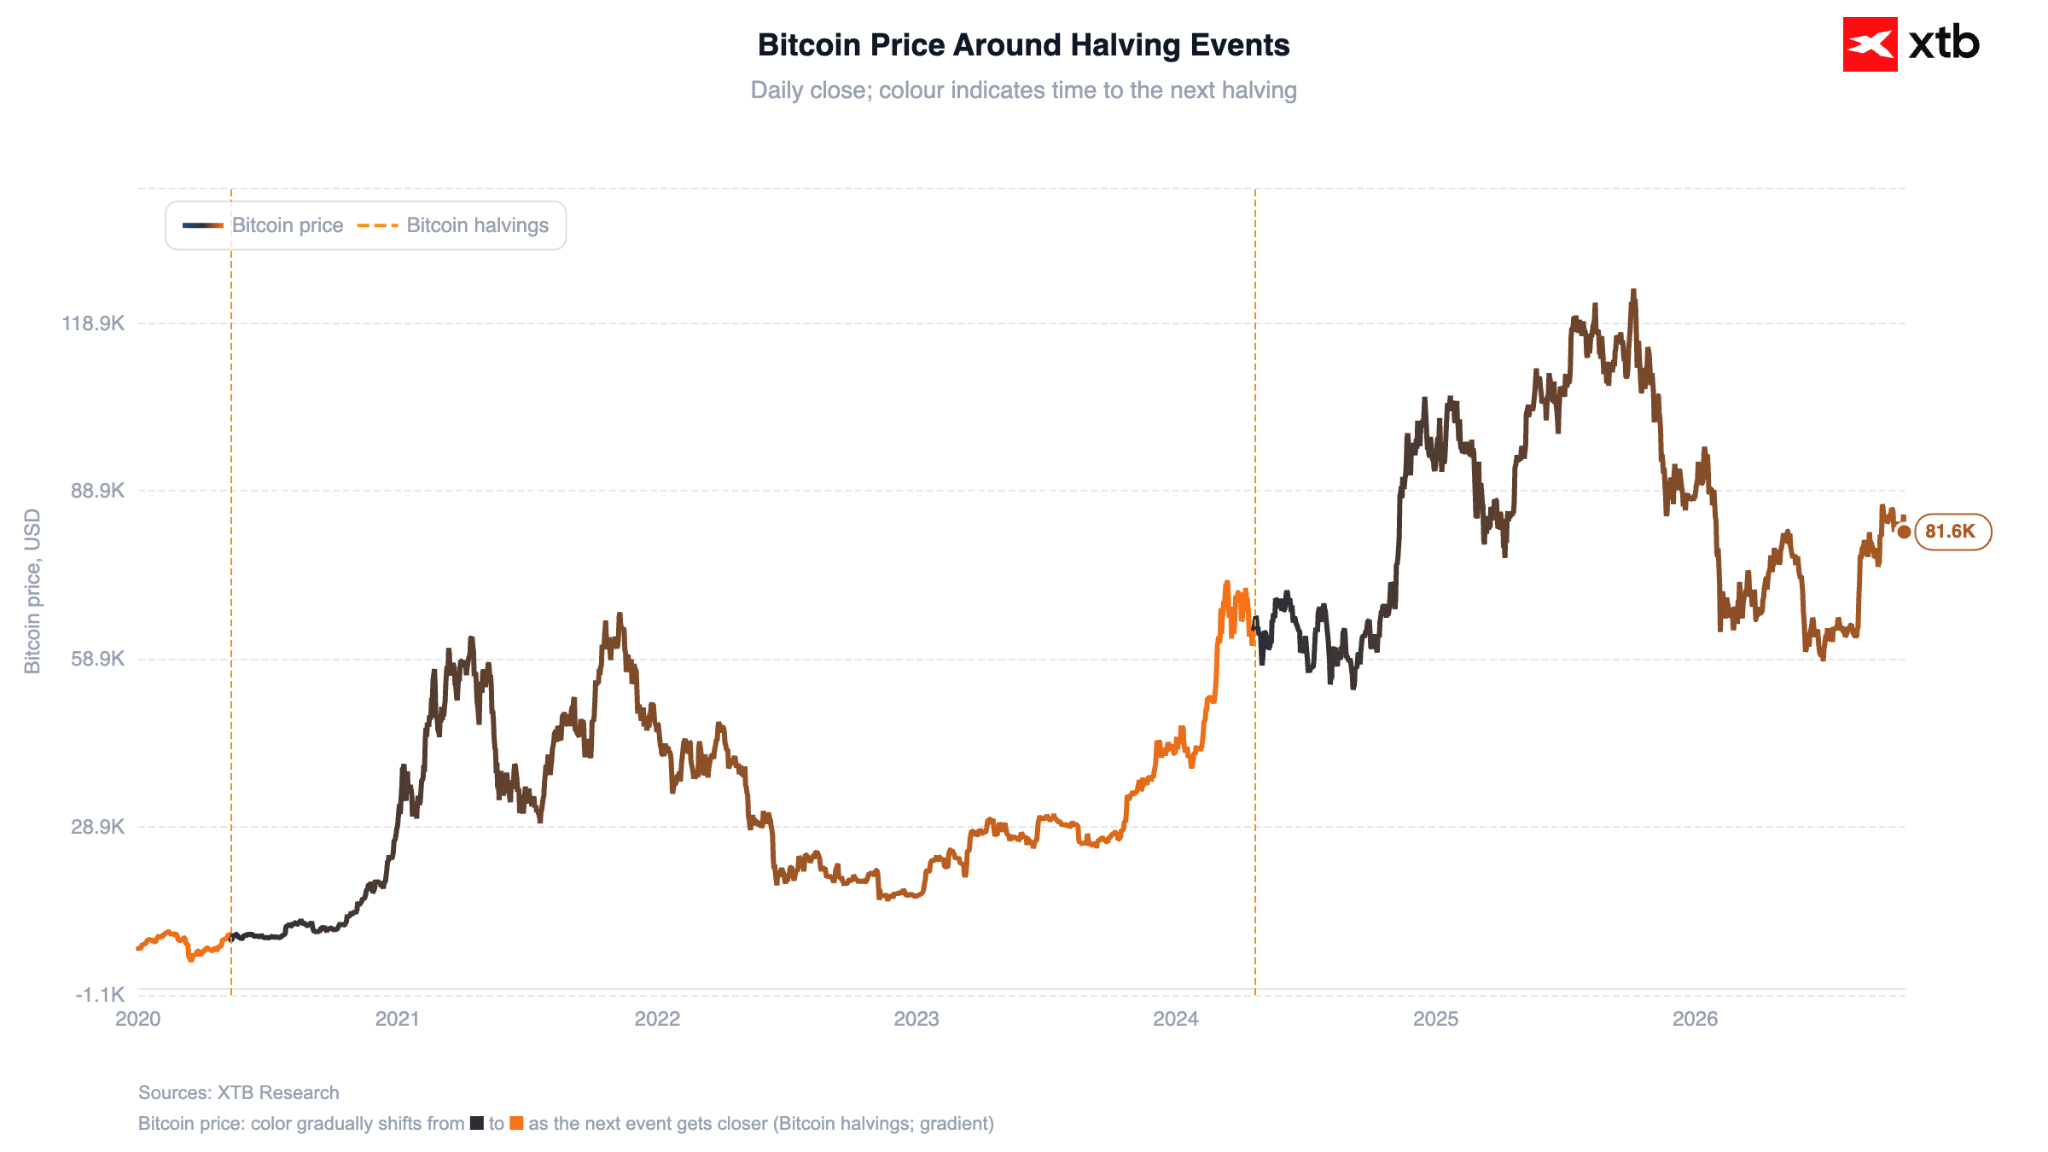
Weakness extended to digital assets, which traded as high-beta risk instruments. Bitcoin slid around 3% below $82,000, while Ethereum fell 3.4%. This reinforces the current market regime in which cryptocurrencies remain tightly correlated with technology equities rather than decoupling, challenging the "digital gold" safe-haven narrative on risk-off days.
Figure 10: Bitcoin Price (2020 - 2026)
 Source: XTB Research, 22.10.2026
—
Michał Jóźwiak, Financial Markets Analyst at XTB



Daily Summary: Valuations Under Pressure, Capital Moves Away From Technology


Tesla was supposed to burn $5 billion, but posted a positive result. Will Tesla still be a car company in a year?


Record-breaking Meta, though with a cash loss. Investors (for now) are buying Zuckerberg's plan anyway


Daily Summary: SpaceX and the tech sector drive Wall Street, oil retreats sharply below $97
This content has been created by XTB S.A. This service is provided by XTB S.A., with its registered office in Warsaw, at Prosta 67, 00-838 Warsaw, Poland, entered in the register of entrepreneurs of the National Court Register (Krajowy Rejestr Sądowy) conducted by District Court for the Capital City of Warsaw, XII Commercial Division of the National Court Register under KRS number 0000217580, REGON number 015803782 and Tax Identification Number (NIP) 527-24-43-955, with the fully paid up share capital in the amount of PLN 5.869.181,75. XTB S.A. conducts brokerage activities on the basis of the license granted by Polish Securities and Exchange Commission on 8th November 2005 No. DDM-M-4021-57-1/2005 and is supervised by Polish Supervision Authority.