
The EURUSD pair has recently been moving within a relatively narrow range, alternating between gains and losses. It started the week with a downward move following negative news regarding the situation in the Middle East.
Geopolitics
Yesterday, the Tasnim News Agency reported that the exchange of messages between the US and Iran has been suspended. This move is reportedly a protest by Iran against continuous Israeli attacks on Lebanon. The probability of reaching a swift agreement between the parties is falling, which weighs on market sentiment.
After President Trump ordered Israel to halt its attacks on Beirut, while simultaneously stating that talks were progressing "at a lightning pace," market sentiment stabilized slightly, allowing the EURUSD pair to recover some of its losses. However, the news coming out of Tehran and Washington remains highly inconsistent, meaning that sentiment may stay volatile.
Macroeconomic Data
Behind us is the release of inflation data from the Eurozone. An upside surprise in the core gauge (an increase to 2.5%) seems to all but seal a June interest rate hike. The market-implied probability of such a move currently stands at 96%. However, the market reaction has been remarkably subdued.
Ahead of us today is another significant release – the April JOLTS report, which will serve as a prelude to Friday's NFP data. If the data, in line with expectations, shows a still relatively healthy state of the US labor market, bets on a Fed rate hike may increase slightly, providing support for the US dollar.
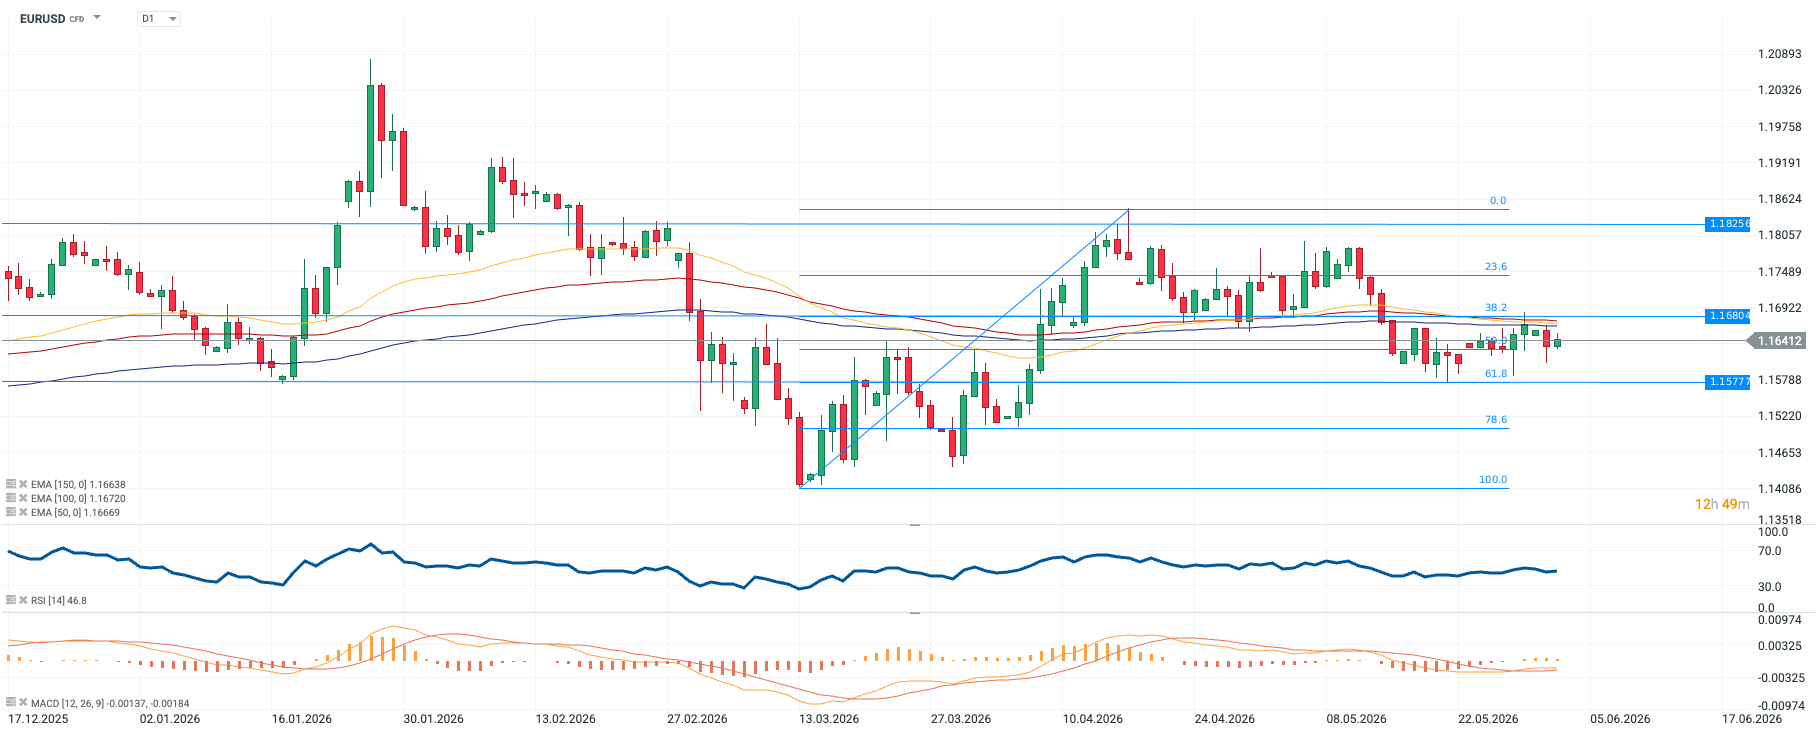
Technical Analysis
Figure 1: EURUSD (17.12.2025 - 02.06.2026)
 Source: xStation, 02.06.2026
The EURUSD pair is currently in a clear consolidation phase, as illustrated by the flattening and intertwining of key exponential moving averages: the 50 EMA, 100 EMA, and 150 EMA. This phenomenon clearly confirms the loss of strong directional momentum and the market's transition into a sideways trend. In a broader technical context, the key event was the testing and successful defense of a significant support level – the 61.8% Fibonacci retracement.
The lack of decisiveness among investors is also reflected in the oscillator readings. The RSI indicator is stabilizing at 46.8 – within the neutral zone, just below the 50 mark. This reflects a balance of market forces with only a minimal advantage for the bearish side, which currently lacks sufficient strength to trigger a deeper sell-off.
—
Michał Jóźwiak, Financial Markets Analyst at XTB

Daily Summary: The Two Faces of AI – Market Fuel and Costly Burden

BREAKING: JOLTS data beats expectations!

US Open: Wall Street loses momentum as AI costs and Middle East tensions cool sentiment

Oil on hold as the market bets on diplomacy
This content has been created by XTB S.A. This service is provided by XTB S.A., with its registered office in Warsaw, at Prosta 67, 00-838 Warsaw, Poland, entered in the register of entrepreneurs of the National Court Register (Krajowy Rejestr Sądowy) conducted by District Court for the Capital City of Warsaw, XII Commercial Division of the National Court Register under KRS number 0000217580, REGON number 015803782 and Tax Identification Number (NIP) 527-24-43-955, with the fully paid up share capital in the amount of PLN 5.869.181,75. XTB S.A. conducts brokerage activities on the basis of the license granted by Polish Securities and Exchange Commission on 8th November 2005 No. DDM-M-4021-57-1/2005 and is supervised by Polish Supervision Authority.