


Market returns to tech after worst week since June
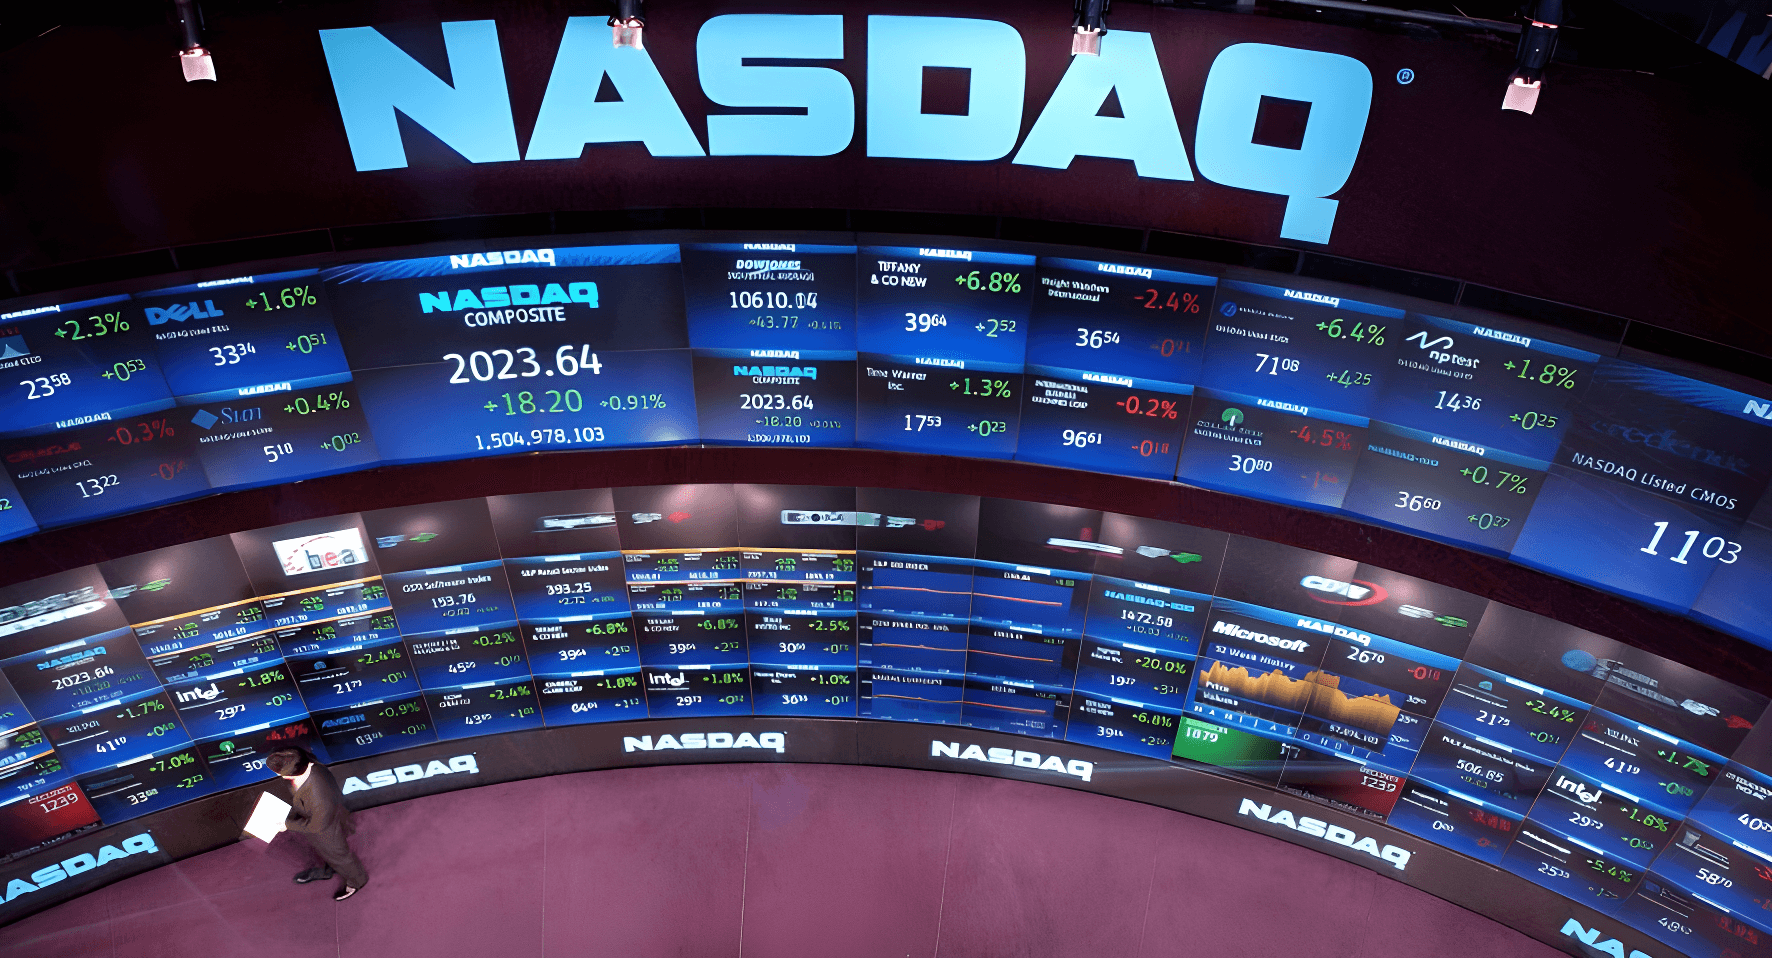
On Monday, the broad Nasdaq Composite index gained 1.11%, closing the session at 26,430 pts, while the Semiconductor Index (SOX) snapped an eight-session losing streak (-15.7% total, the longest since October 2008) with a 1.6% rise. Investors returned to buying discounted chip and AI stocks after the S&P 500 and Nasdaq posted their largest weekly declines since late June last week. The Nasdaq lost 4.5% then, and the tech sector dropped over 6%, the most since April 2025. As Wall Street commentators pointed out: “nothing bad happened over the weekend,” and the market was oversold enough that a rebound was only a matter of time. On the other hand, some compared the current period to Black Monday in the late 1980s, though the session ultimately ended with strong gains.
Under the hood of the rebound, however, selectivity is apparent. Intel gained 2.4% following an upgrade by J.P. Morgan, AMD +1.8%, Micron +3%. On the flip side, CoreWeave—the epicenter of last week's panic over $50 billion in debt—ended the session in the red (-0.4%) despite an upgrade to "buy" by Goldman Sachs, with its CDS levels indicating serious issues. Fund managers warn that the narrative around the "resilience of the AI trade to rate hikes" is changing: the market is starting to assess more selectively whether companies will actually generate a return justifying the debt being taken on. Certainly, the current earnings season could set a new narrative for the market.
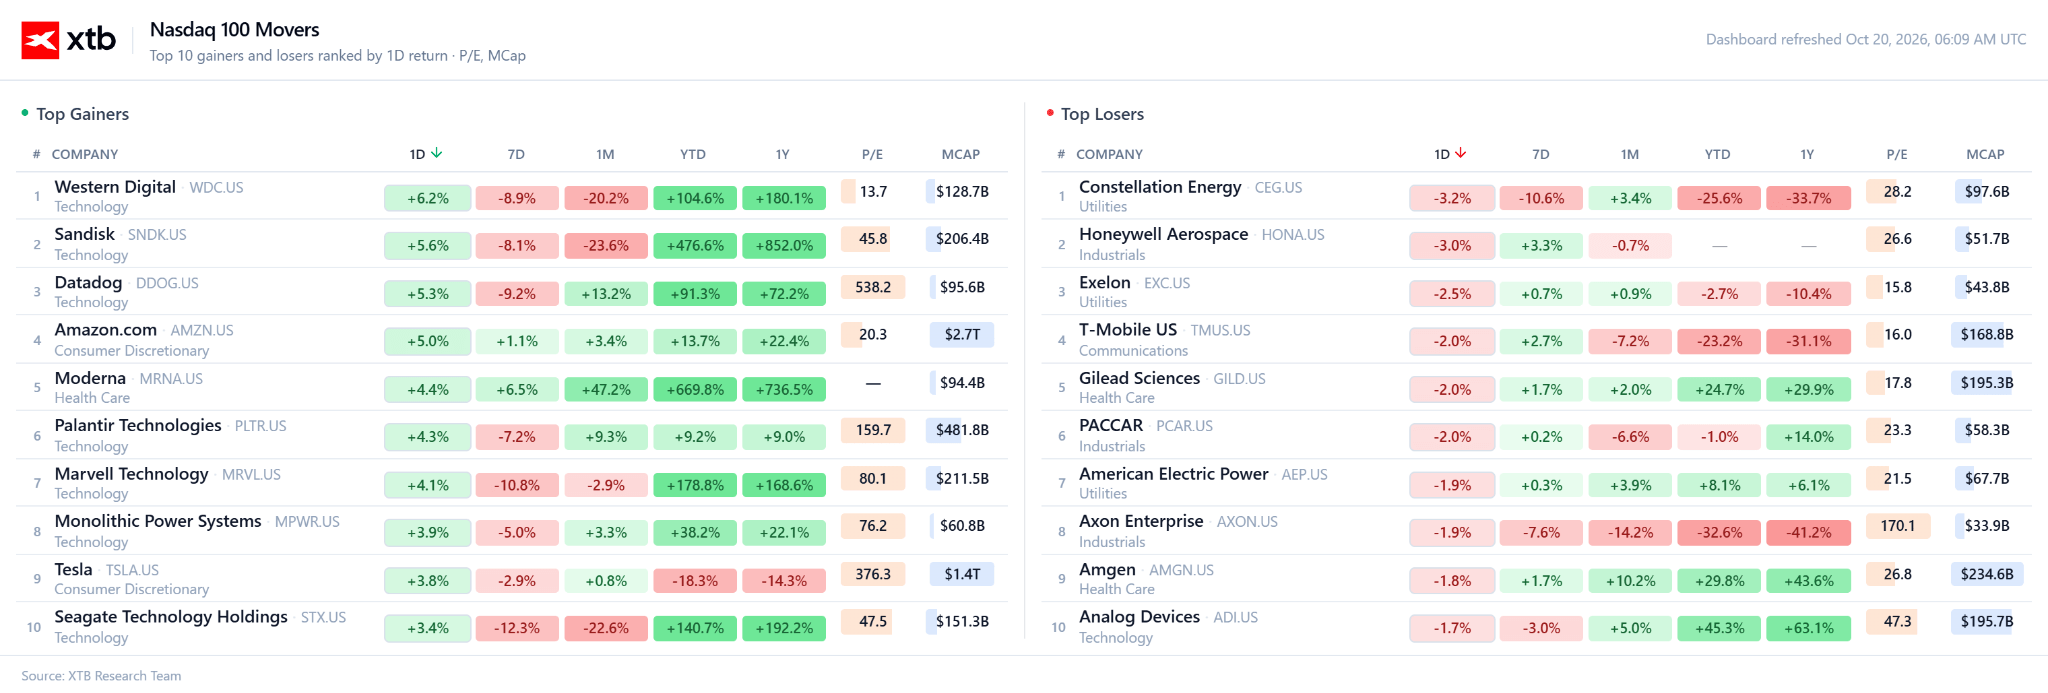
An additional catalyst for optimism comes from reports that Nscale is negotiating the sale of computing power to Anthropic for around $45 billion, while Citigroup estimates that the AI sector will account for nearly 70% of global corporate earnings growth next year.
This week, the key test for sentiment will be earnings from Meta and Tesla (Wednesday) and SpaceX (Tuesday), with Tesla and SpaceX reporting amid growing speculation about a potential merger between Musk's two companies. In the background, geopolitical tensions persist (attacks on energy infrastructure in Russia and the Middle East) along with elevated oil prices, keeping bond yields high.
US100 Technical Analysis
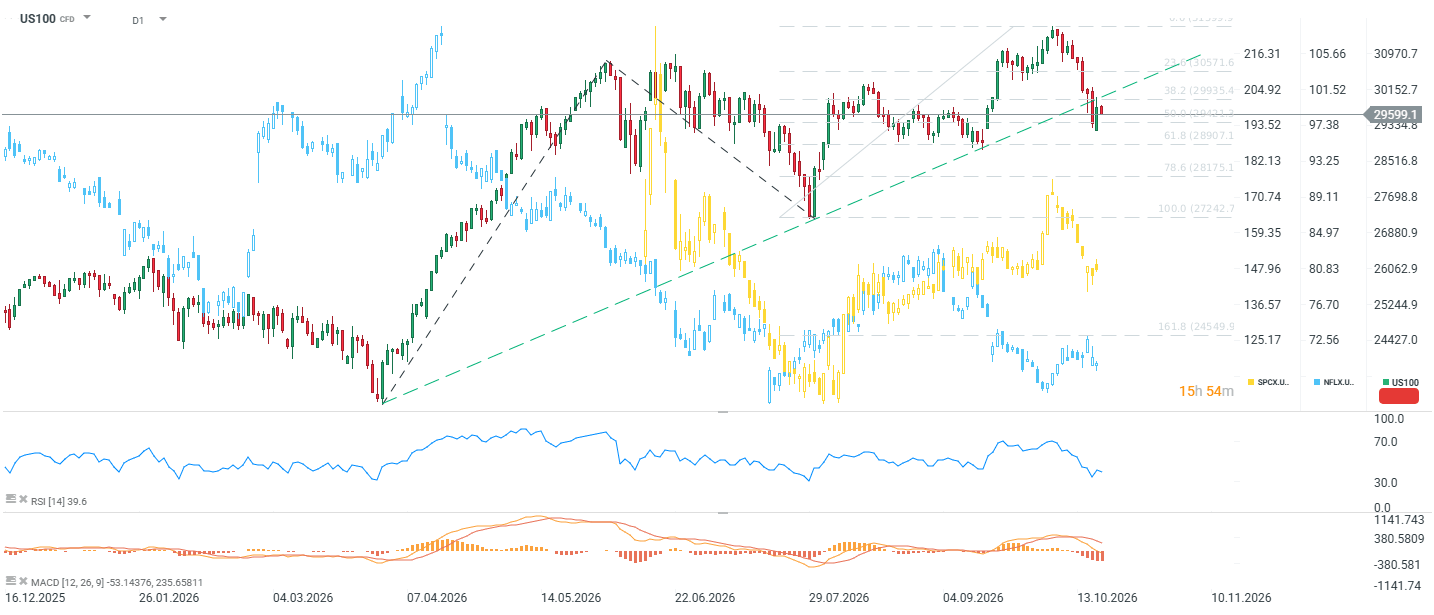
The Nasdaq 100 contract is currently trading below 25,600 pts, well below its October record high (~31,600 pts) and below the upward trendline originating from the April low (~22,400 pts), which price broke in recent sessions. This marks an important shift in market structure compared to previous weeks, when this line acted as dynamic support. On the other hand, this could still be treated as a "false" breakout.
Price currently resides in the 38.2–50.0% Fibonacci retracement zone (29,935–30,421 pts), suggesting that the correction of the recent upward move is already advanced. The RSI(14) at 39.6 is approaching the oversold zone but has not reached it yet, meaning the market potentially still has room for a continued decline before technical indications for a bounce appear. The MACD is distinctly negative (MACD line -53.1, signal line -235.7, with the histogram remaining below zero since mid-September), confirming the dominance of supply in recent weeks, though it is worth noting that the negative histogram has recently been shrinking slightly. This is a signal of weakening downside momentum, but not yet a trend reversal.
Key levels:
- Resistance: 29,935 (38.2% retracement), 30,421–30,572 (50.0–23.6%), 31,600 (ATH / 0.0)
- Support: 28,907 (61.8%), 28,175 (78.6%), 27,243 (100.0% - August low)
The breach of the upward trendline and the drop in RSI below 40 serve as warning signals for the continuation of the 2026 bull run. Unless the price firmly defends above 29,935–30,000, the risk of a further slide toward the 28,900–28,200 zone remains elevated. Only a return above 30,570 (the vicinity of the former resistance line, now potentially being tested from below) would negate the weak signal and open the door for a renewed attempt at the highs.
Conclusion
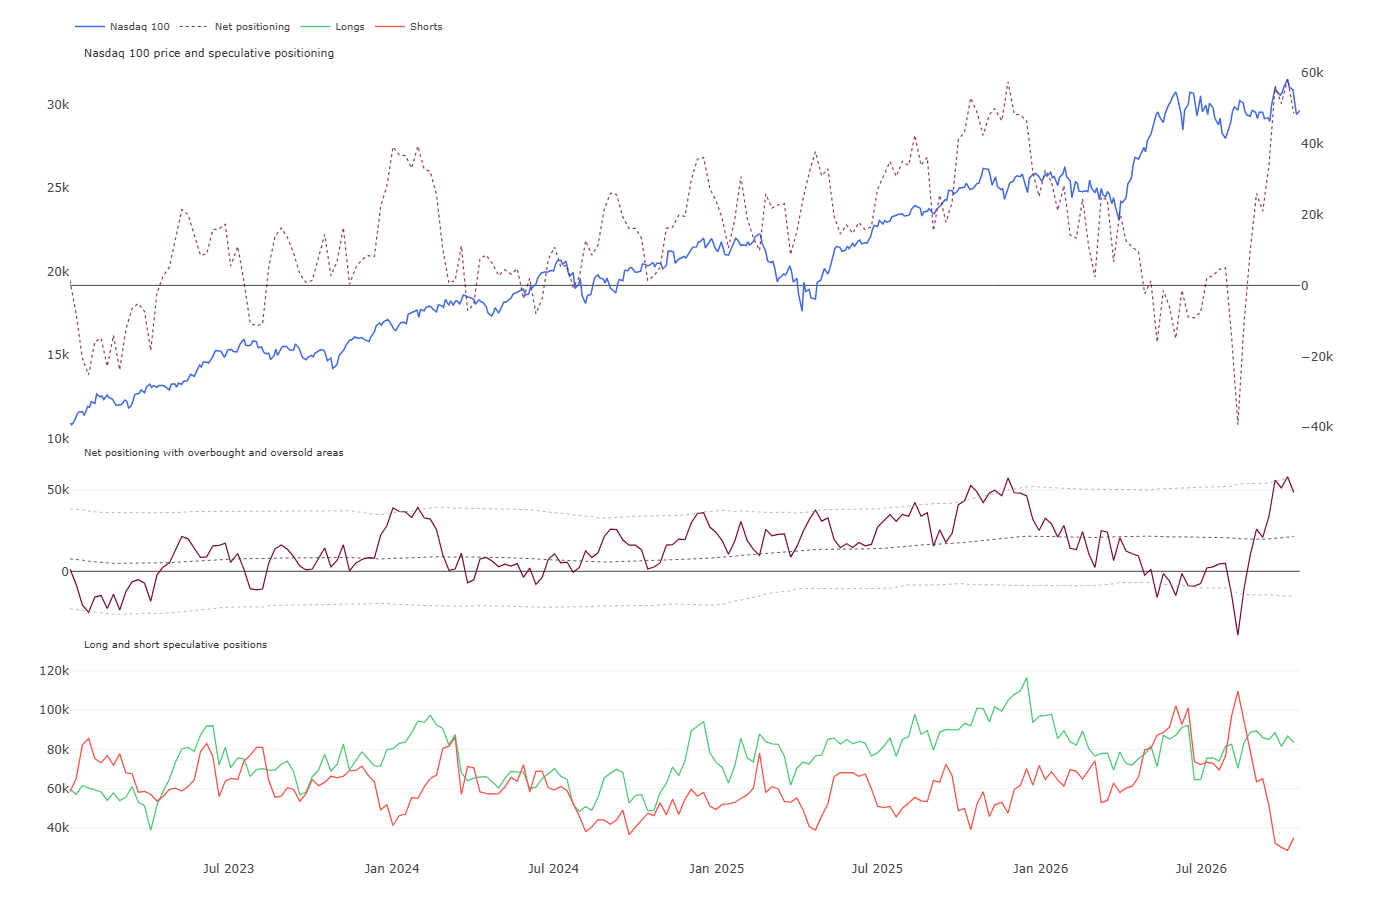
Monday's Wall Street rebound is a tangible sign that the market was technically oversold and investors still believe in the fundamentals of the AI investment cycle. At the same time, the US100 chart itself does not yet confirm this optimism. The breakdown of the long-term upward trendline and a weak RSI suggest treating Monday's move as a technical rebound within a broader correction rather than a return to the main uptrend. Earnings results from Meta, Tesla, and SpaceX this week, as well as further developments surrounding CoreWeave's debt and other "neoclouds," will be key to whether the US100 holds the 29,900–30,000 zone or deepens its decline toward 28,900–28,200. It is worth noting an interesting aspect regarding positioning, however. Recently, a massive number of speculative short positions on Nasdaq 100 futures were closed. This short covering moved the net positioning from an extreme oversold zone to an extreme overbought area. Nevertheless, the correlation between net positioning and the index itself remains relatively low.


CoreWeave: Record Demand Collides with Crushing Costs



Macro Calendar - UK Labor Market, ZEW Sentiment, and Wall Street Giants' Reports


Chart of the Day: What’s next for tech stocks after the deepest sell-off since April 2025? (19.10.2026)


Economic Calendar: Big tech earnings week and test for the AI rally (19.10.2026)
This content has been created by XTB S.A. This service is provided by XTB S.A., with its registered office in Warsaw, at Prosta 67, 00-838 Warsaw, Poland, entered in the register of entrepreneurs of the National Court Register (Krajowy Rejestr Sądowy) conducted by District Court for the Capital City of Warsaw, XII Commercial Division of the National Court Register under KRS number 0000217580, REGON number 015803782 and Tax Identification Number (NIP) 527-24-43-955, with the fully paid up share capital in the amount of PLN 5.869.181,75. XTB S.A. conducts brokerage activities on the basis of the license granted by Polish Securities and Exchange Commission on 8th November 2005 No. DDM-M-4021-57-1/2005 and is supervised by Polish Supervision Authority.