The EURUSD is down more than 0.2% today, falling from its multi-year high near 1.192 to 1.176. This move pushed the RSI indicator down to 34, signaling oversold conditions. Looking at the technical setup of the pair, we can see that a similar 1:1 impulse was triggered between late August and early September, followed by two smaller but also symmetrical corrections.
The price has dropped below two key exponential moving averages — the EMA50 and EMA200 (orange and red lines). The decline in the pair has been driven by relatively strong recent U.S. economic data, particularly from the labor market. Yesterday, weekly jobless claims fell by nearly 30,000, marking the sharpest drop since 2021, easing fears of recession and further labor market weakness. Today, the U.S. dollar is also gaining more than 0.2%.
Start investing today or test a free demo
Create account Try a demo Download mobile app Download mobile appEURUSD (H1 Interval)
The key task for the pair will be to climb back above the EMA200 (red line), which could signal a bullish impulse. On the other hand, a decline below 1.17 could undermine the ongoing upward trend and increase the likelihood of a larger correction following record gains.
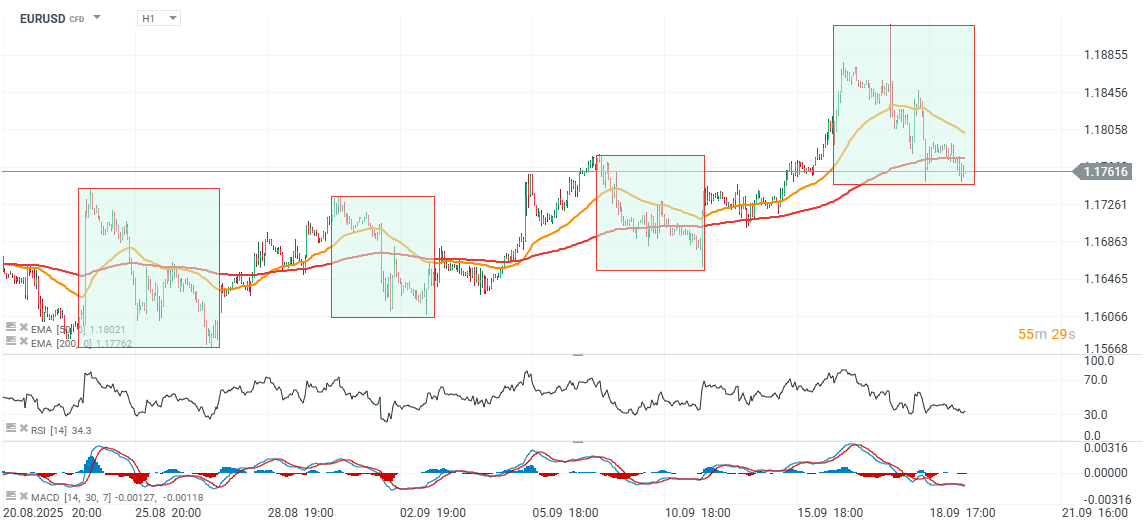
Source: xStation5
This content has been created by XTB S.A. This service is provided by XTB S.A., with its registered office in Warsaw, at Prosta 67, 00-838 Warsaw, Poland, entered in the register of entrepreneurs of the National Court Register (Krajowy Rejestr Sądowy) conducted by District Court for the Capital City of Warsaw, XII Commercial Division of the National Court Register under KRS number 0000217580, REGON number 015803782 and Tax Identification Number (NIP) 527-24-43-955, with the fully paid up share capital in the amount of PLN 5.869.181,75. XTB S.A. conducts brokerage activities on the basis of the license granted by Polish Securities and Exchange Commission on 8th November 2005 No. DDM-M-4021-57-1/2005 and is supervised by Polish Supervision Authority.