



Copper lost nearly 6% on Wednesday, marking its deepest single-day drop since April 2025 (and the infamous Liberation Day). Since the beginning of the month, the move has already exceeded 13%. One pound of copper currently costs around USD 5.66, the lowest level in seven months.
Fundamentals
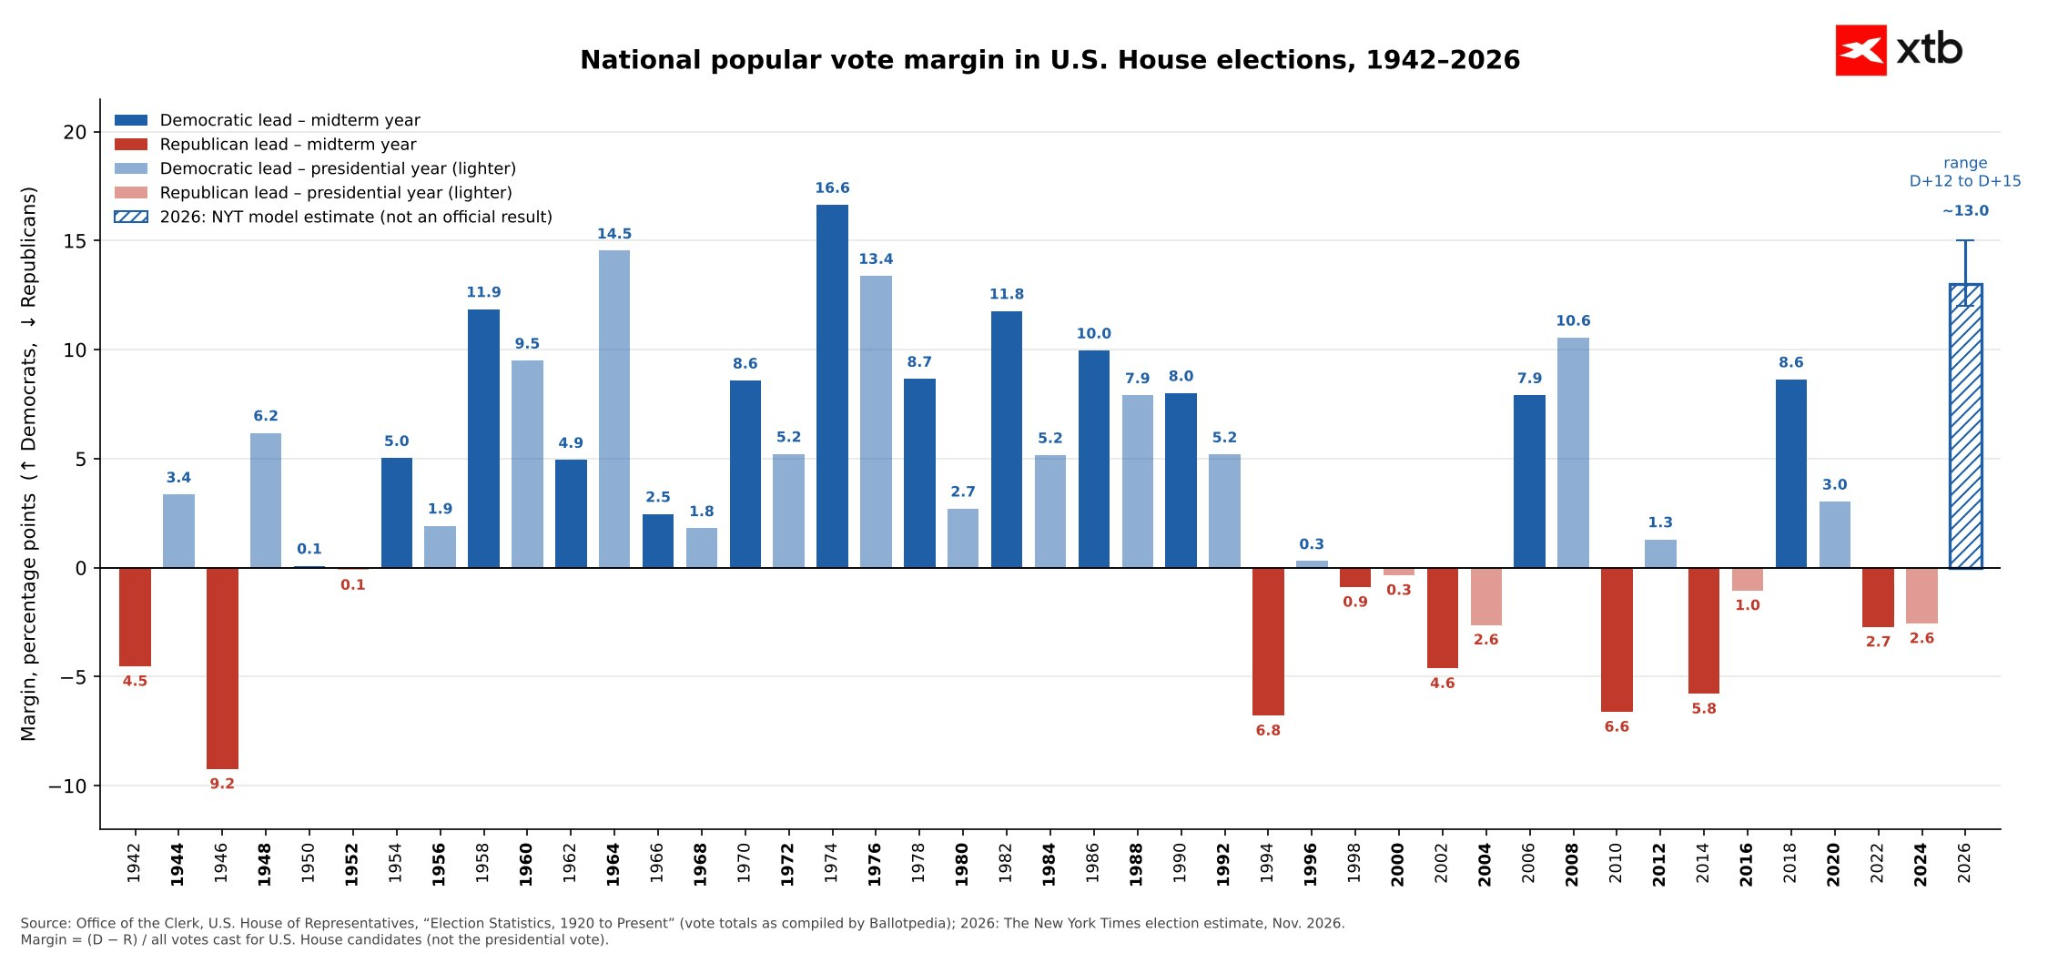
In recent months, copper has been gaining primarily due to expectations of very high demand from companies building data centres and modernising the power grid. Doubts over whether such a dynamic increase in the pace of AI spending is indeed justified, along with regulatory concerns following the Democratic victory in the midterm elections, are therefore weighing directly on the metal.
Figure 1: National popular vote margin in U.S. House elections (1942-2026)
 Source: XTB Research, Office of the Clerk, The New York Times, 19.11.2026
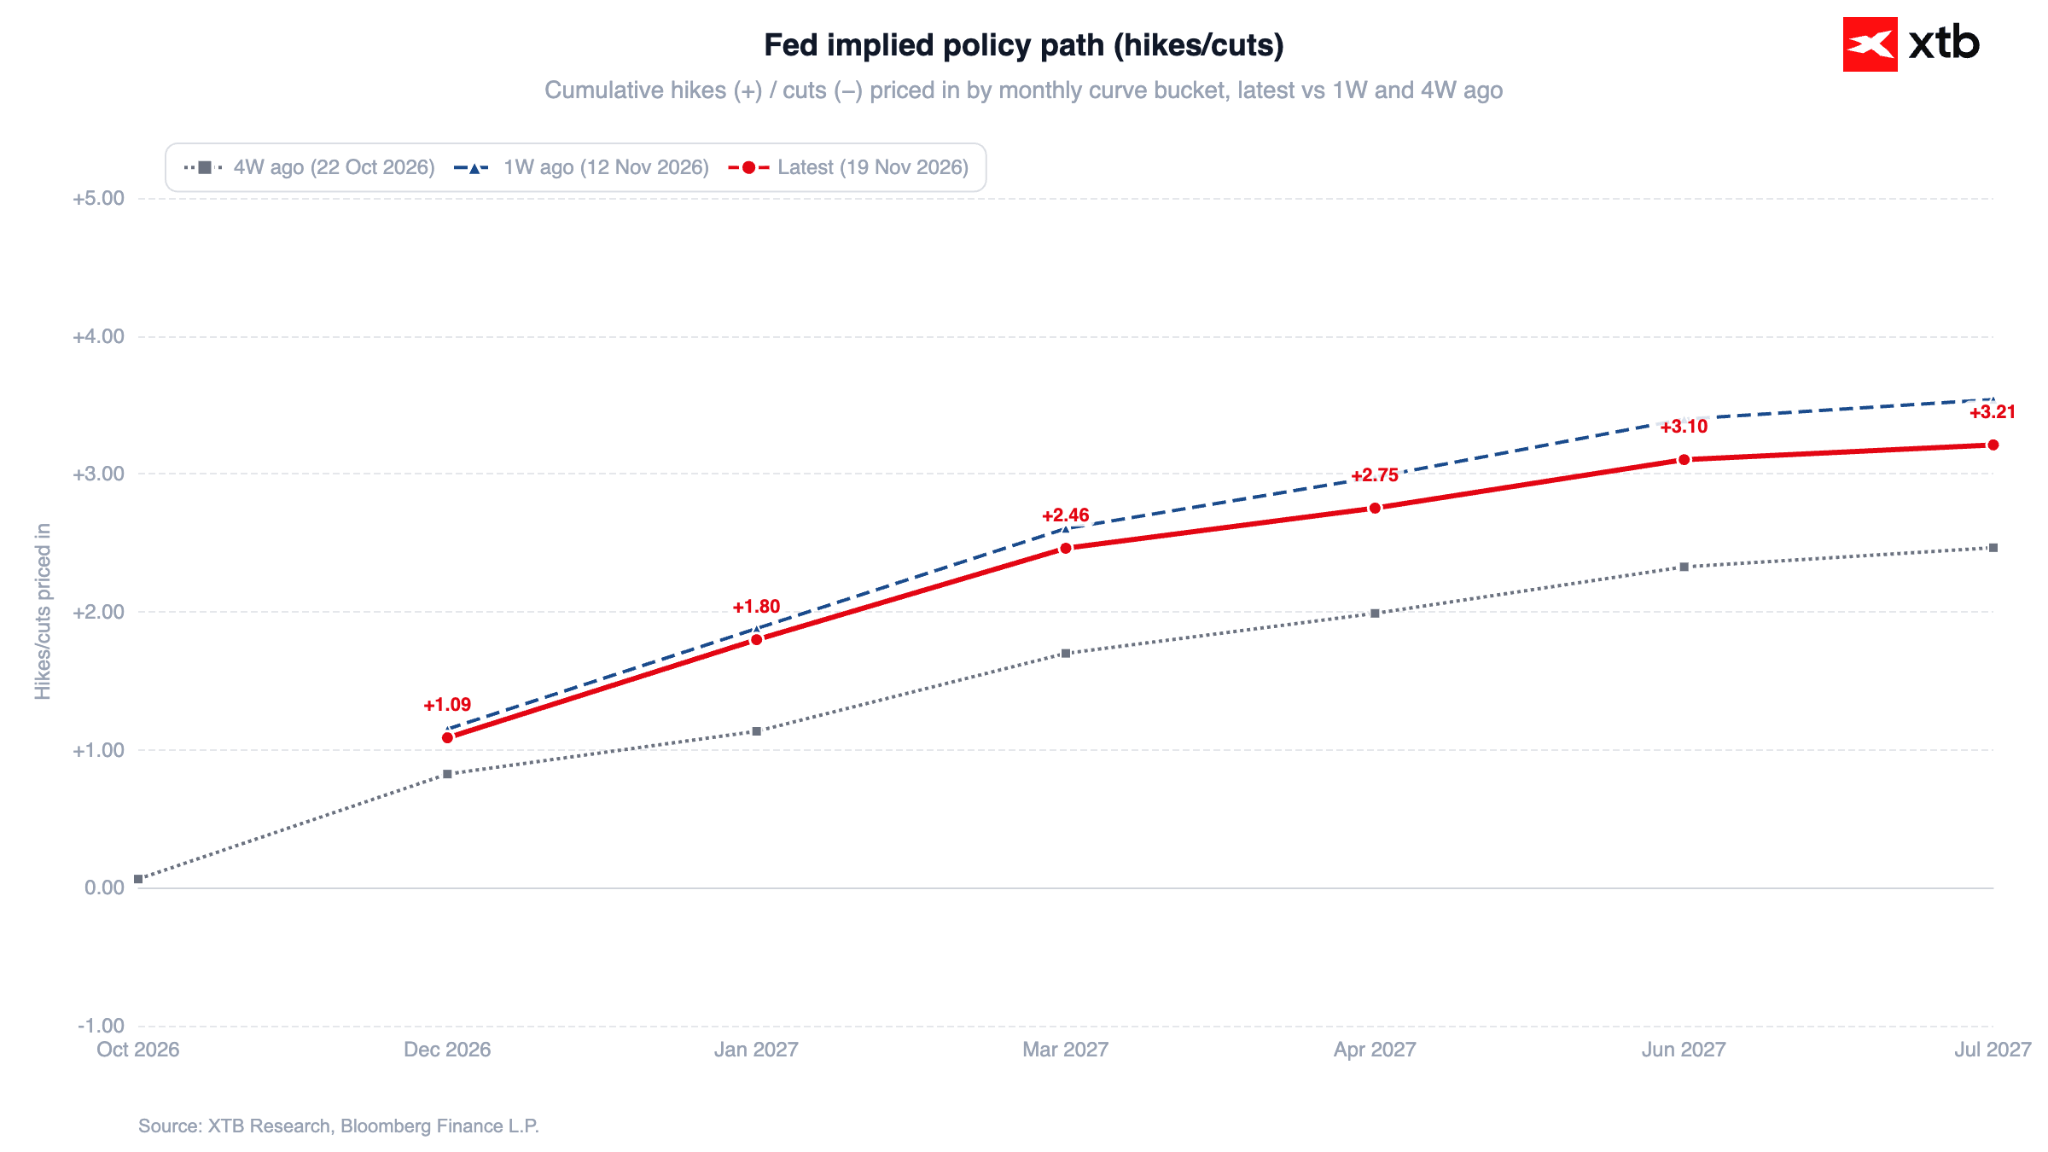
The US dollar naturally played a role as well. Triggered by a hawkish repricing of the Fed's interest rate path, the strengthening of the American currency raised the price of copper for buyers outside the US (as the metal is priced in dollars).
Figure 2: Market-implied Fed interest rate path (2026-2027)
 Source: XTB Research, 19.11.2026
Origins of the move
Yesterday's move was further reinforced by Stanley Druckenmiller, one of the most prominent advocates of the thesis that copper prices would rise driven by the AI bull market, as he revealed that he currently holds a short position on the metal.
However, it is also worth noting that Monday's industrial production data from China (4.8% y/y) surprised to the downside, while monthly copper output in Chile rose to 388 thousand tonnes.
Technical perspective
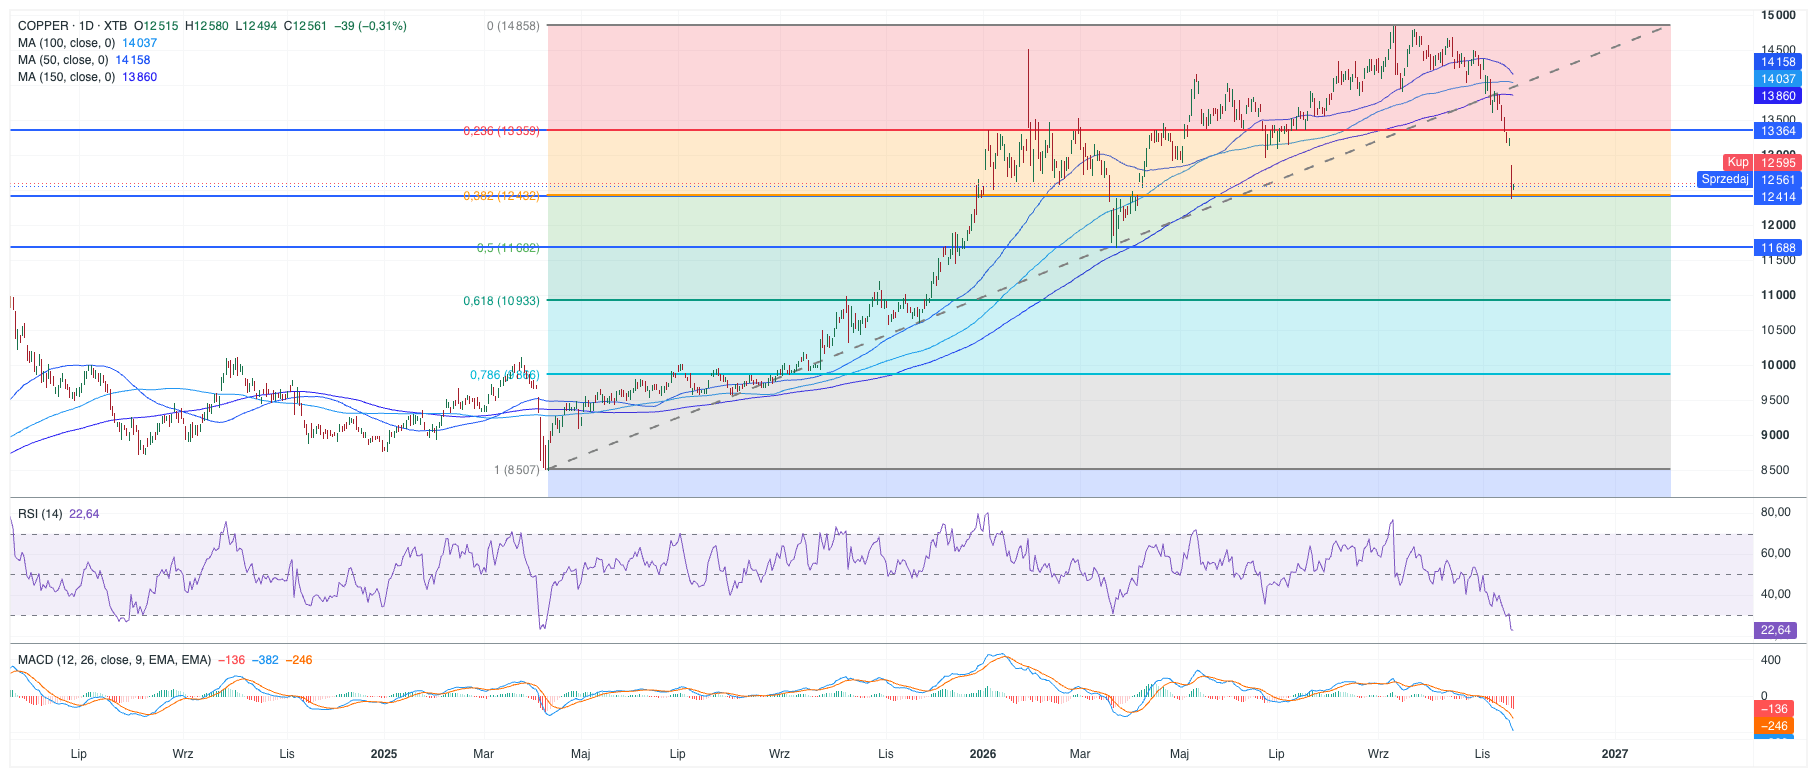
Copper prices are hovering around USD 12,560 per tonne, close to the levels seen at the beginning of the year.
The RSI has fallen below 23 points, signaling deep oversold conditions. A negative MACD setup and the price push more than 10% below the 50-session moving average confirm strong seller dominance, despite the long-term moving averages remaining formally in a bullish configuration.
The immediate key support zone lies around USD 12,400, with the next target near USD 11,680. The nearest major technical resistance runs around USD 13,360.
Figure 3: COPPER (2024-2026)
 Source: XTB, 19.11.2026
—
Michał Jóźwiak, Financial Markets Analyst at XTB


Market Wrap: Anthropic Lifts Sentiment, but a Hawkish Fed Keeps the Dollar High


Economic Calendar: Trump-Xi Jinping-Putin summit ongoing, time for Walmart results (19.11.2026)



The ANT Feelgood Factor


Morning Wrap: Time for the largest stock market debut in history (19.11.2026)
This content has been created by XTB S.A. This service is provided by XTB S.A., with its registered office in Warsaw, at Prosta 67, 00-838 Warsaw, Poland, entered in the register of entrepreneurs of the National Court Register (Krajowy Rejestr Sądowy) conducted by District Court for the Capital City of Warsaw, XII Commercial Division of the National Court Register under KRS number 0000217580, REGON number 015803782 and Tax Identification Number (NIP) 527-24-43-955, with the fully paid up share capital in the amount of PLN 5.869.181,75. XTB S.A. conducts brokerage activities on the basis of the license granted by Polish Securities and Exchange Commission on 8th November 2005 No. DDM-M-4021-57-1/2005 and is supervised by Polish Supervision Authority.