



The EIA, as part of the DOE, published its weekly fuel inventory report on Wednesday, which presented a mixed but generally supportive picture for crude oil prices. Despite this, crude oil prices are not showing significant volatility following the release.
EIA Data:
- Crude Oil: inventories fell by 3.060 million barrels, significantly more than the expected draw of 0.8–1.2 million barrels. The previous reading showed a decline of as much as 8.557 million barrels. Current data marks the 3rd consecutive drop in crude inventories.
- Gasoline: inventories decreased by 2.952 million barrels compared to a projected drop of just 0.33–0.44 million. A week earlier, an increase of 3.518 million barrels was recorded.
- Distillates (diesel, heating oil): unexpected build of 1.675 million barrels, while the market expected a draw of 1.3 million barrels.
Divergence with API Data
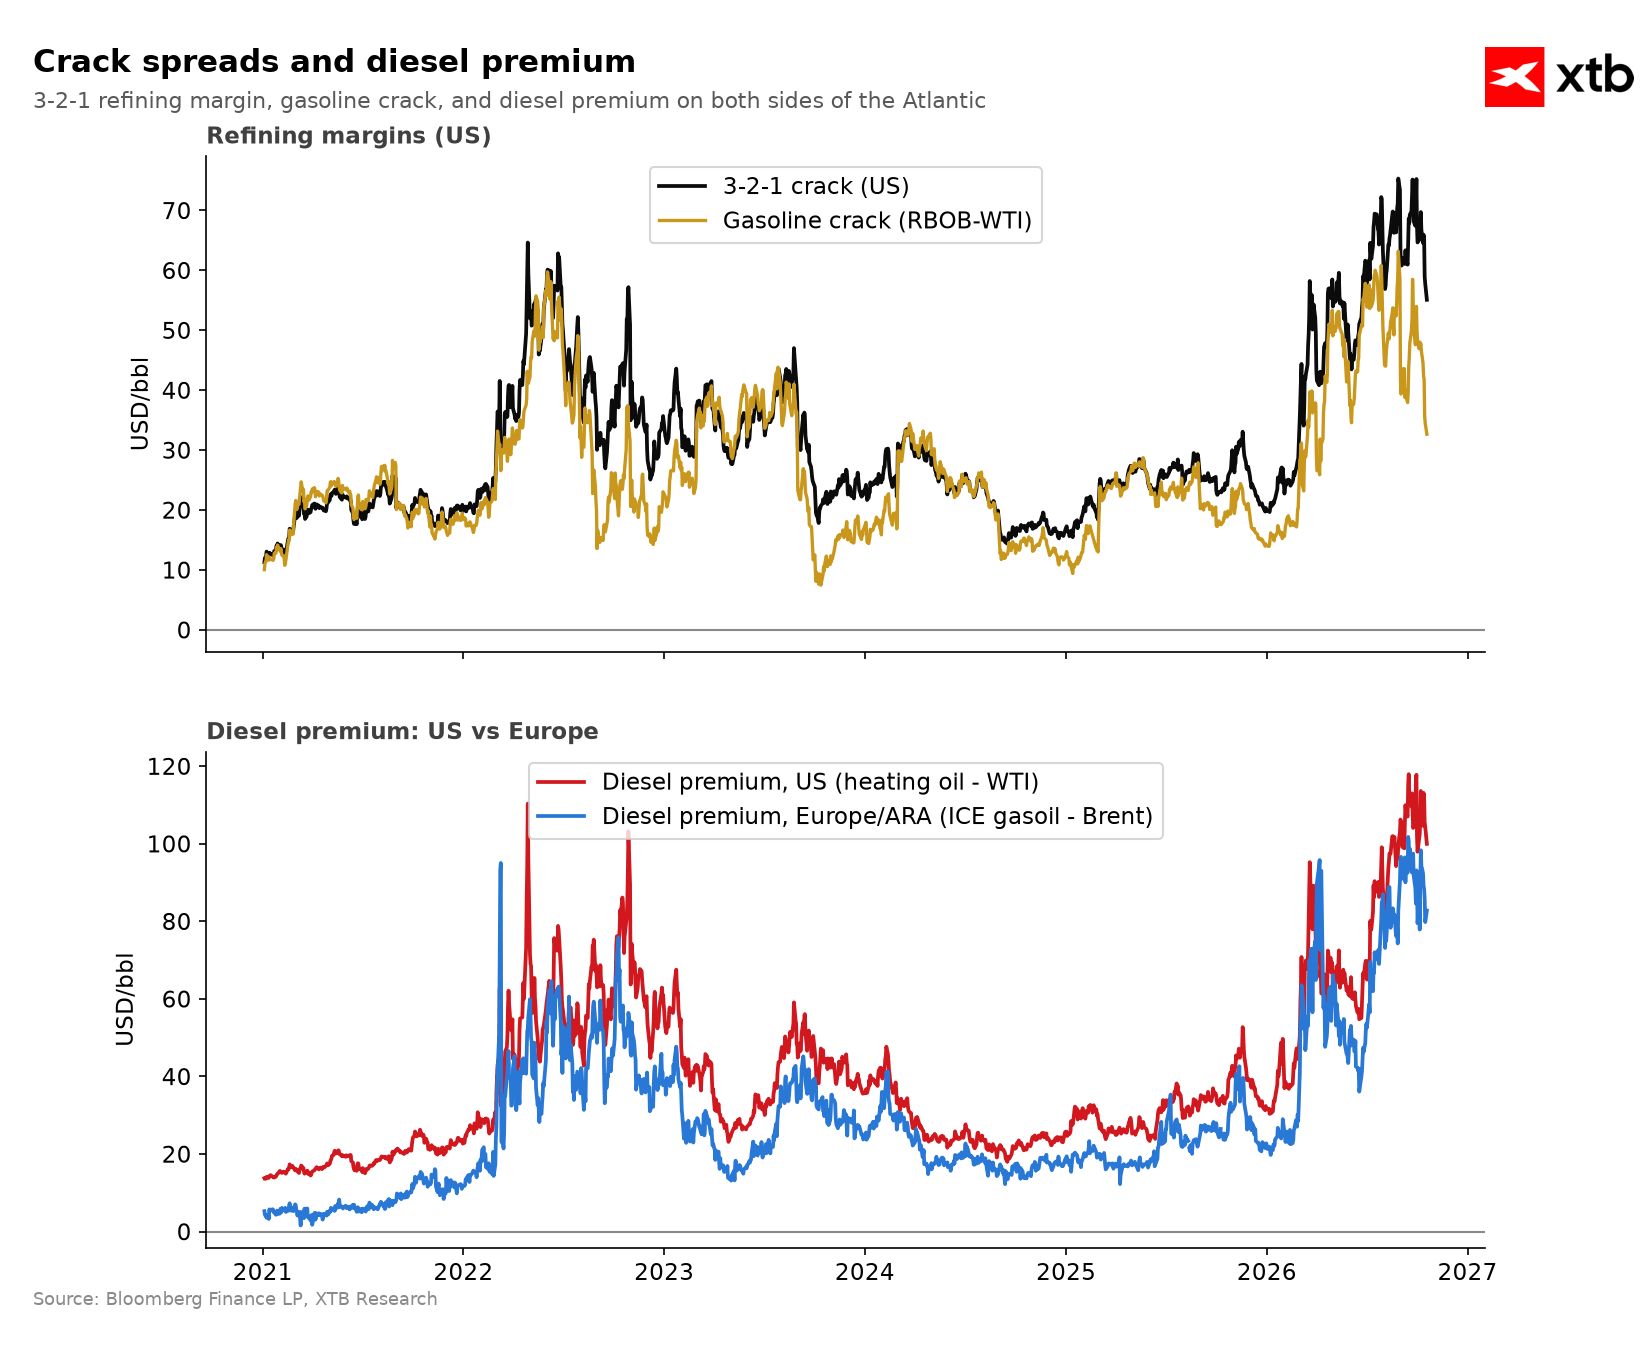
Tuesday's American Petroleum Institute (API) report pointed to an even deeper draw in crude oil inventories (-4.93 million barrels vs. -1.3 million expected), a similar direction in gasoline (-2.0 million), and a 1.6 million barrel drop in distillates, which is exactly opposite to what the official EIA data ultimately showed. Inventories in Cushing (a key delivery hub) rose by 900 thousand barrels. This divergence in the distillate segment is the most crucial element of the report and weakens the clearly bullish tone suggested by earlier private data. This situation is quite interesting and most likely aimed at depressing distillate prices ahead of the upcoming midterm elections.
Market Commentary
Declines in crude oil and gasoline inventories are fundamentally supportive for prices, but the build in distillate inventories takes some shine off the report. It is worth remembering that inventory changes also reflect refinery activity and trade flows, so drops alone do not prove stronger final demand.
WTI crude is currently trading around 97.7 USD/bbl, slightly down on the day. The daily low reached USD 96.92, just below the support zone at USD 97, while the high was USD 100.40. The price returned above the 100-hour moving average (USD 97.69), approaching resistance near USD 98.48.
WTI Technical Analysis
The daily chart shows a clear upward structure with two distinct consolidation zones that served as rebound points in the uptrend ongoing since the June low (~USD 66).
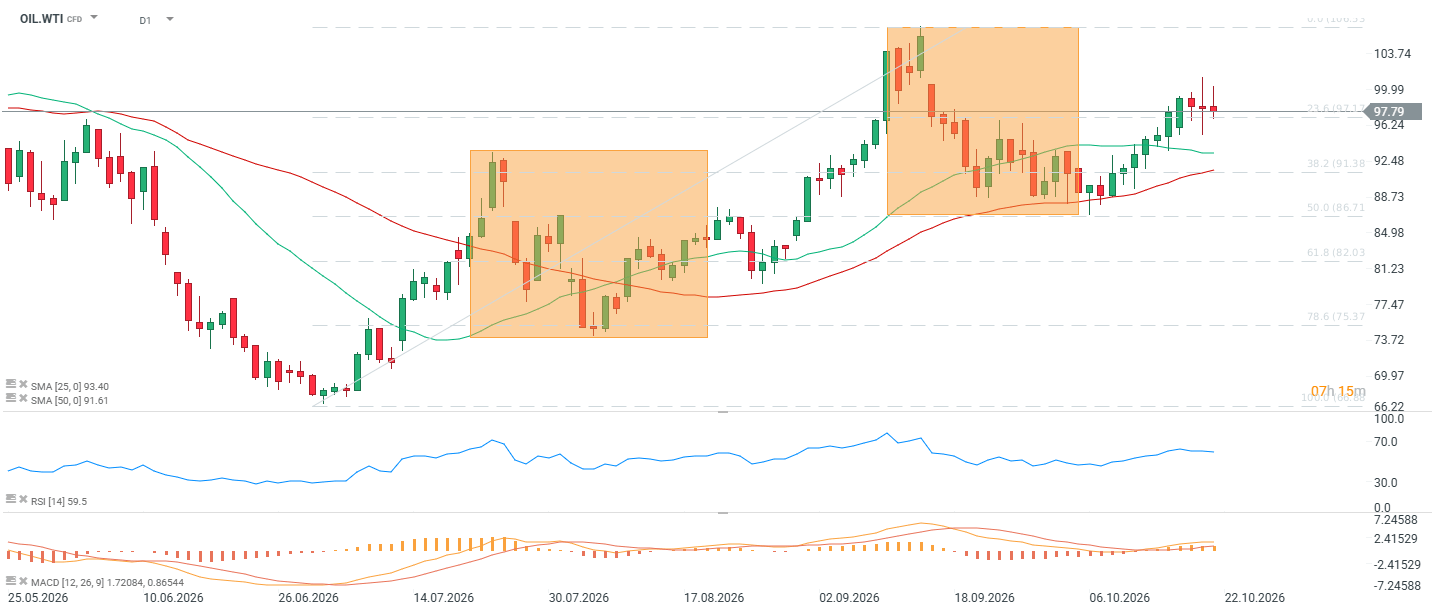
SMA25 (93.40) and SMA50 (91.61) lie well below the current price, confirming the intact medium-term upward structure. Price is consolidating just above both averages following a strong September rally from USD 84 to 103. RSI (14) at 59.5 remains neutral with a slight demand bias, not overbought, leaving room for continued upward movement. Meanwhile, MACD (12,26,9) remains in a pro-growth setup: value 1.72084 vs signal 0.86544, with a positive and rising histogram—momentum supports the bulls, though the rate of acceleration has slowed somewhat compared to the September peak momentum.
The market is consolidating just below key resistance at USD 97–100 following a dynamic September increase. The larger-than-expected draw in crude oil and gasoline inventories supports short-term bullish sentiment, but a breakout above the USD 98.48–100 zone would require volume confirmation to open the path toward testing the September peak at USD 103.74. Loss of support near USD 96.24 would direct prices back toward USD 92.48–93.40 (SMA25).



Daily Summary: SpaceX and the tech sector drive Wall Street, oil retreats sharply below $97


📉NATGAS loses 6% ahead of rollover


Russia is selling off gold reserves. Why, to whom, and does it matter for the market?


US OPEN: Preparations for Tesla's mega-merger with SpaceX. Diplomatic stalemate with Iran cools Wall Street's enthusiasm
This content has been created by XTB S.A. This service is provided by XTB S.A., with its registered office in Warsaw, at Prosta 67, 00-838 Warsaw, Poland, entered in the register of entrepreneurs of the National Court Register (Krajowy Rejestr Sądowy) conducted by District Court for the Capital City of Warsaw, XII Commercial Division of the National Court Register under KRS number 0000217580, REGON number 015803782 and Tax Identification Number (NIP) 527-24-43-955, with the fully paid up share capital in the amount of PLN 5.869.181,75. XTB S.A. conducts brokerage activities on the basis of the license granted by Polish Securities and Exchange Commission on 8th November 2005 No. DDM-M-4021-57-1/2005 and is supervised by Polish Supervision Authority.