



Bitcoin surged from around $63,000 to roughly $82,000 in early September, but a sharp rise in bond yields, oil approaching $100 a barrel, uncertainty over future Fed policy and growing concerns about rate-hiking cycles at other central banks continue to weigh on its outlook.
Bitcoin price subdued ahead of Friday’s CPI release
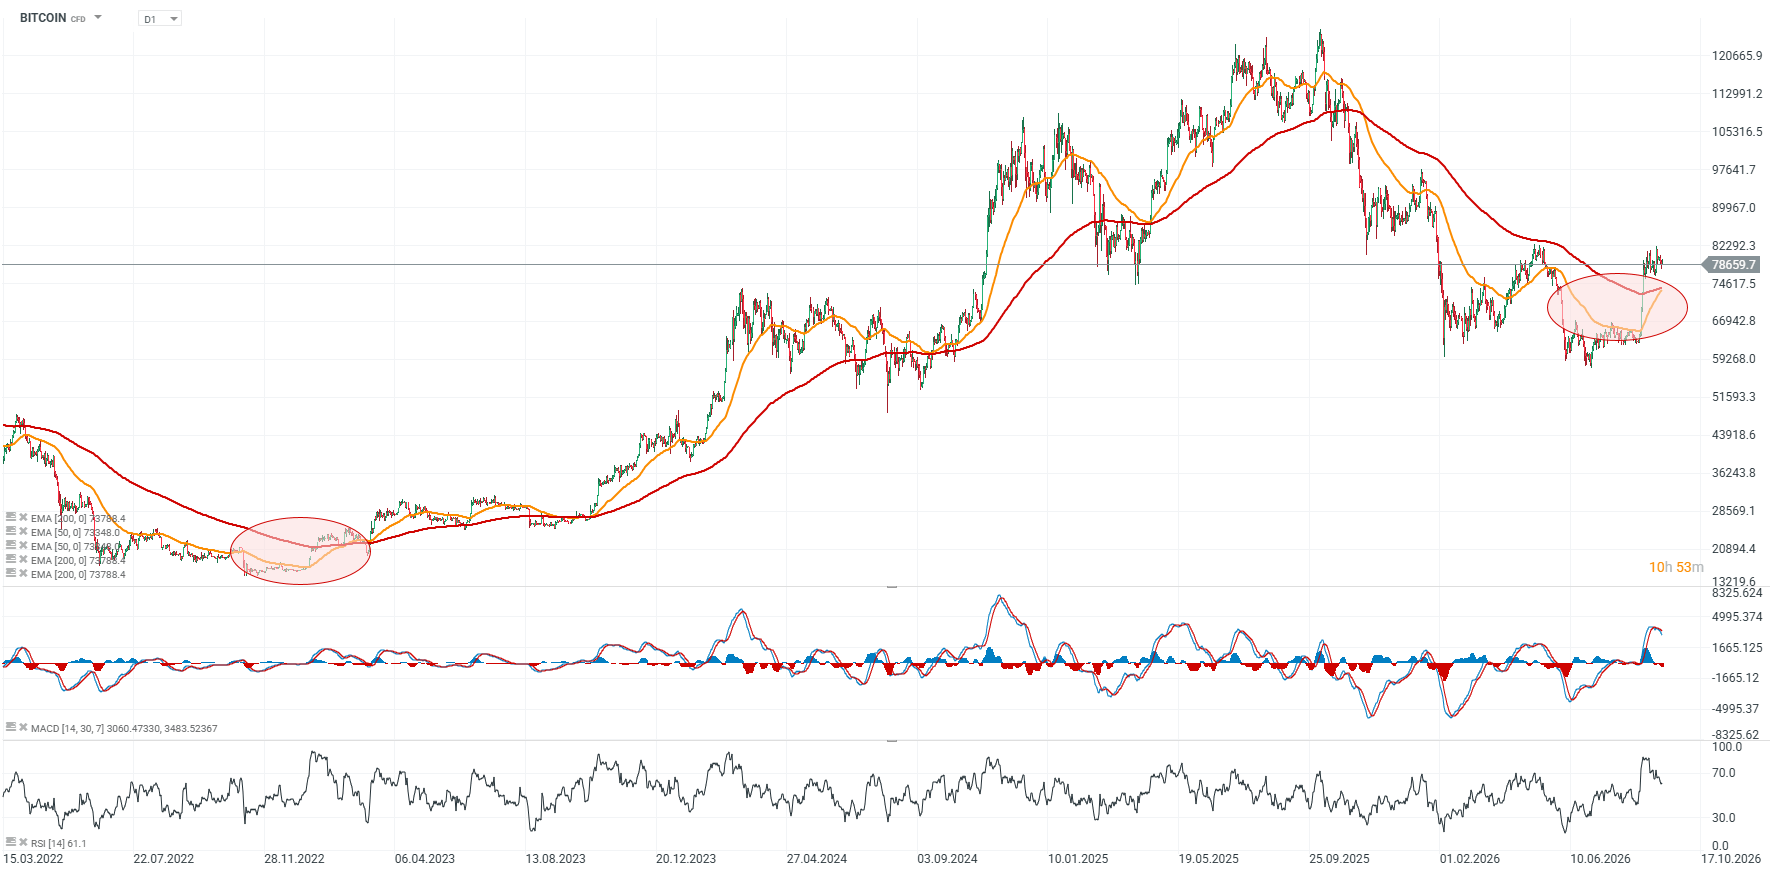
As a result, BTC has pulled back once again to $78,000, shortly after reclaiming the $80,000 area. Sentiment across other cryptocurrencies remains weaker. On-chain activity has improved, but ETF inflows have slowed over the past few sessions. A key test for cryptocurrencies will be the US CPI data for August, due at 2:30 p.m. CEST on Friday. A higher-than-expected reading could send Bitcoin back below $70,000, while a softer-than-forecast release would likely help BTC stabilize above $80,000, turning that level from resistance into important support.
The prospect of crypto-friendly regulation in the US is taking a back seat for now, as Republicans trail Democrats in polls ahead of the congressional midterm elections. The future of the Crypto Clarity Act appears uncertain, and the legislation may not be signed into law until mid-2027. If oil prices fall and the US Treasury continues actively purchasing debt securities, this could support Bitcoin, as well as gold and, more broadly, assets negatively correlated with the dollar.
Bitcoin price chart (D1 timeframe)
The largest cryptocurrency retains its momentum, although the RSI has cooled to around 61 and the MACD is showing a potentially bearish crossover. The 200-day exponential moving average (EMA200) is near $74,000, but the $60,000–$70,000 range appears to be a more “natural” support zone should the rebound lose steam. Key resistance lies around $81,500–$82,000, where the latest advance stalled and where strong price reactions marked local highs this spring. Meanwhile, the area around $77,000 provides important short-term support.
Source: xStation5
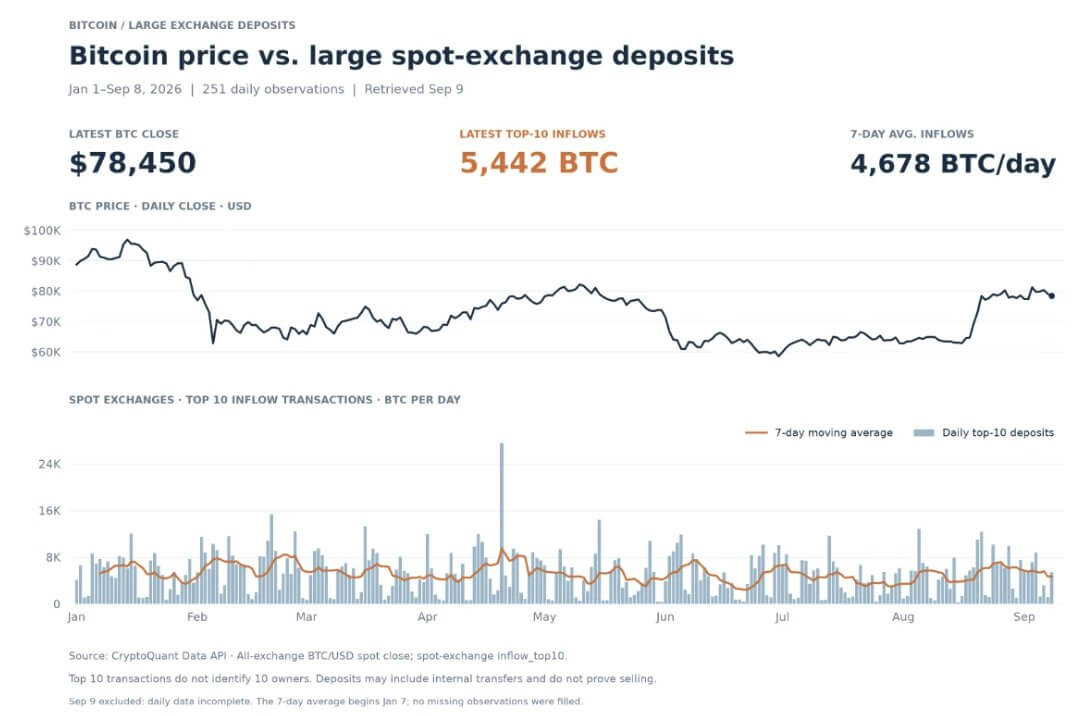
Bitcoin near $80,000 without a surge in large exchange deposits
Interestingly, despite the substantial rebound, large deposits to spot exchanges have not shown a comparable increase in recent weeks. According to CryptoQuant, the combined volume of the 10 largest deposits to spot exchanges reached 5,442 BTC on September 8, just 5% above the preceding 30-day average. The seven-day average stood at approximately 4,670 BTC. So far, the price recovery has not coincided with unusually elevated large-deposit activity. It is worth monitoring whether average inflows begin to rise persistently while prices weaken.
Source: CryptoQuant
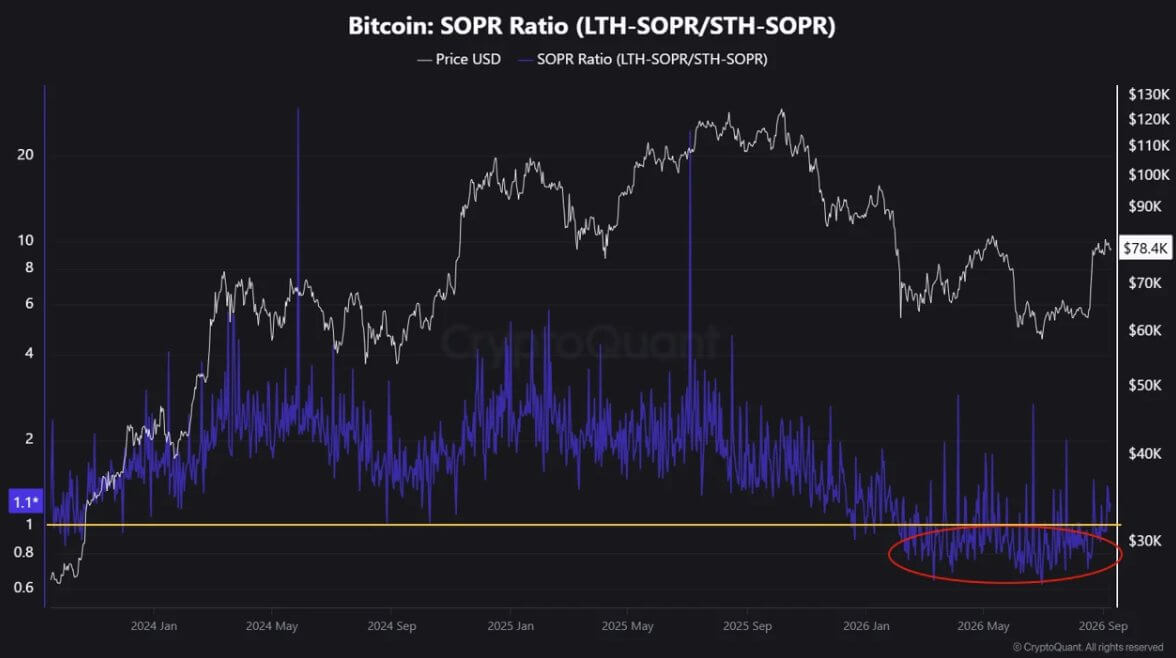
Long-term holders are selling at a loss
Periods when even medium- and long-term investors consistently sold Bitcoin at a loss have most often proved to be good opportunities for long-term accumulation. Those were the periods when SOPR fell below 1. In most cases, market participants’ interest also hit rock bottom at the same time. If this measure is taken as a meaningful indicator of sentiment, Bitcoin still appears relatively cheap.
Source: CryptoQuant
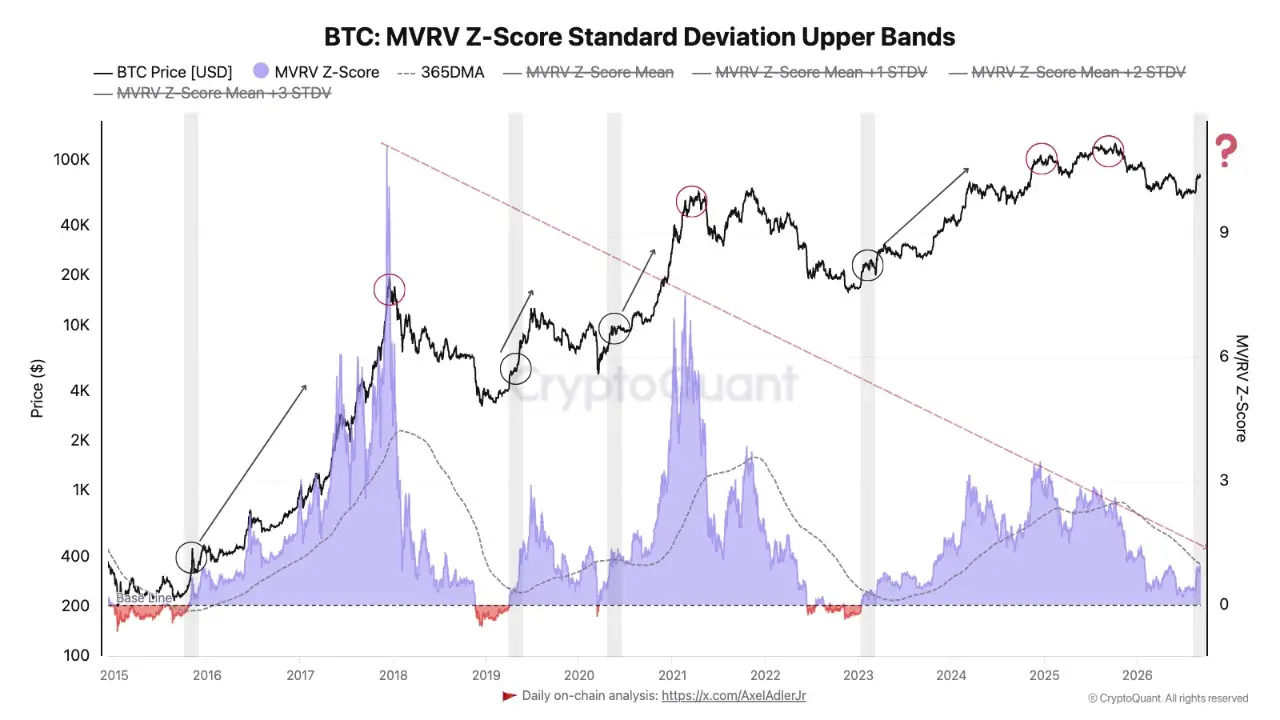
MVRV is approaching a regime test. Not a bull signal yet
Bitcoin has yet to reach either a level that historically marked the start of bull markets or one that signaled their end. The on-chain metric known as the MVRV Z-Score is approaching one of the key levels used to identify the market regime: its one-year moving average. Historically, sustained moves back above this average have signaled a transition from a recovery phase into a bull market. According to CryptoQuant, the reclaim in 2015–2016 preceded the 2017 bull market, while a similar move in 2020 preceded the 2020–2021 rally. Moreover, the return above the moving average in 2023 accompanied the latest bull market.
MVRV remains below its 365-day moving average, so the market has not yet confirmed a return to an uptrend. A rejection in this area would suggest that Bitcoin investors’ aggregate profitability is too low to support a rebound. A sustained move back above the average would point to a recovery in unrealized gains. There is another important difference: in previous cycles, market bottoms coincided with the Z-Score falling below zero into the undervaluation zone, whereas the current bear market has not produced such a move. In summary, either Bitcoin is undergoing a structurally shallower correction, or it has yet to experience capitulation on the scale seen at previous long-term lows.
Source: CryptoQuant


European TTF gas futures hit highest level since 2022 as inventories remain low ahead of winter


Market Wrap: A sunk tanker drags european stocks lower



Morning wrap (09.09.2026)


Oil, Apple and JPY in focus
This content has been created by XTB S.A. This service is provided by XTB S.A., with its registered office in Warsaw, at Prosta 67, 00-838 Warsaw, Poland, entered in the register of entrepreneurs of the National Court Register (Krajowy Rejestr Sądowy) conducted by District Court for the Capital City of Warsaw, XII Commercial Division of the National Court Register under KRS number 0000217580, REGON number 015803782 and Tax Identification Number (NIP) 527-24-43-955, with the fully paid up share capital in the amount of PLN 5.869.181,75. XTB S.A. conducts brokerage activities on the basis of the license granted by Polish Securities and Exchange Commission on 8th November 2005 No. DDM-M-4021-57-1/2005 and is supervised by Polish Supervision Authority.