
-
Strong Growth, Negative Reaction: Microsoft beat revenue and earnings consensus, yet shares fell 3% after-hours amid investor anxiety over AI investment ROI.
-
Azure Maintains Momentum: The key Azure segment grew 39% (above forecast), confirming the robust strength of the company's cloud business.
-
CapEx Concerns Emerge: Lower-than-expected Capital Expenditure (CapEx) and warnings on future margin pressure fueled market doubts regarding the pace of monetization of costly AI projects.
-
Strong Growth, Negative Reaction: Microsoft beat revenue and earnings consensus, yet shares fell 3% after-hours amid investor anxiety over AI investment ROI.
-
Azure Maintains Momentum: The key Azure segment grew 39% (above forecast), confirming the robust strength of the company's cloud business.
-
CapEx Concerns Emerge: Lower-than-expected Capital Expenditure (CapEx) and warnings on future margin pressure fueled market doubts regarding the pace of monetization of costly AI projects.
Microsoft delivered solid financial results for the first quarter of fiscal year 2026 (ended September 30, 2025), surpassing analyst expectations across key metrics, particularly showing robust growth in its cloud business segments. Despite the strong performance, the company's shares fell by as much as 3% in after-hours trading, reflecting persistent investor anxiety over the Return on Investment (ROI) from massive AI infrastructure spending.
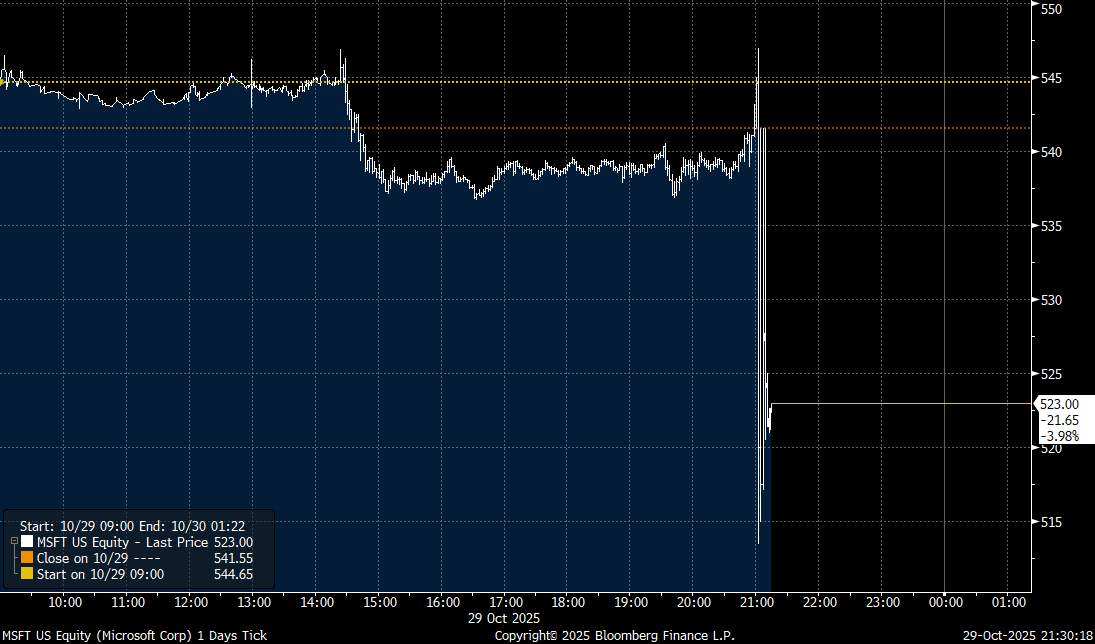
Microsoft shares decline in after-hours trading. Source: Bloomberg
Key Quarterly Financial Highlights
Revenue and Profitability:
-
Revenue: $77.7 Billion (+18% YoY, +17% in constant currency) vs. $75.55 Billion consensus.
-
Operating Income: $38.0 Billion (+24% YoY) vs. $35.1 Billion consensus.
-
EPS (GAAP): $3.72 (+13% YoY).
-
EPS (non-GAAP): $4.13 (+23% YoY), excluding the impact of the OpenAI investment.
-
Net Income (GAAP): $27.7 Billion (+12% YoY).
Capital Expenditure (CapEx):
-
CapEx: $19.39 Billion — significantly below the $23.04 Billion consensus. This divergence may be seen as a disappointment by those seeking aggressive spending, but could also suggest that further expenditure may not substantially accelerate the revenue outlook.
Business Segment Results
Intelligent Cloud (Core Growth Driver):
-
Revenue: $30.9 Billion (+28% YoY) vs. $30.18 Billion consensus.
-
Azure and other cloud services: +39% YoY (ex-FX) vs. +37.1% consensus.
Productivity and Business Processes:
-
Revenue: $33.02 Billion (+17% YoY) vs. $32.29 Billion consensus.
-
Microsoft 365 Commercial cloud: +17% YoY (+15% in constant currency).
-
Microsoft 365 Consumer cloud: +26% YoY.
-
LinkedIn: +10% YoY.
-
Dynamics 365: +18% YoY.
More Personal Computing:
-
Revenue: $13.76 Billion (+4% YoY) vs. $12.88 Billion consensus.
-
Windows OEM: +6% YoY.
-
Search and Advertising (ex-TAC): +16% YoY.
Why Are Shares Declining?
Despite beating expectations on revenue and earnings, the market reacted negatively due to several factors:
-
ROI Concerns over AI Investment: Microsoft is spending tens of billions of dollars on AI infrastructure (approx. $80 Billion in FY2025), yet investors are demanding more convincing evidence of proportional returns from this outlay.
-
Guidance and Future CapEx: The market was looking for clear signals of accelerating AI monetization. The lower-than-expected CapEx ($19.39 Billion vs. $23 Billion consensus) may suggest Microsoft is adjusting the pace of investment, raising questions about demand momentum.
-
AI Infrastructure Competition: Reports of Oracle reportedly taking on some infrastructure orders from OpenAI (a key Microsoft partner) may signal a loss of momentum in the hyperscale segment.
-
Margin Pressure: CFO Amy Hood had previously warned that margins could be pressured amid the expansion of data centers. While the operating margin was 45% this quarter, continued heavy investment could erode it further.
-
Valuation Premium: Microsoft shares trade at a forward P/E of around 35, commanding a premium over the broader market. Investors expect this high valuation to be justified by spectacular AI revenue growth, which has yet to fully materialize.
Positive Indicators
-
Microsoft Cloud Revenue: $49.1 Billion (+26% YoY).
-
Remaining Performance Obligations: Increased by 51% to $392 Billion — a strong signal of future demand.
-
Free Cash Flow: The company generated $45.1 Billion from operating activities during the quarter.
-
Capital Return to Shareholders: $10.7 Billion returned via dividends and share repurchases.
Summary
Microsoft delivered solid results, surpassing consensus on revenue, operating profit, and EPS. Azure's 39% growth (above the 37% forecast) confirms the strength of the cloud platform. However, the market appears to be penalising the company for the lack of clear indication on how its past investments will translate into greater future profits. Furthermore, emerging competition in the cloud infrastructure segment raises question marks for one of the market leaders. Nevertheless, it must be acknowledged that the company's prospects for continued growth and development remain extremely strong.
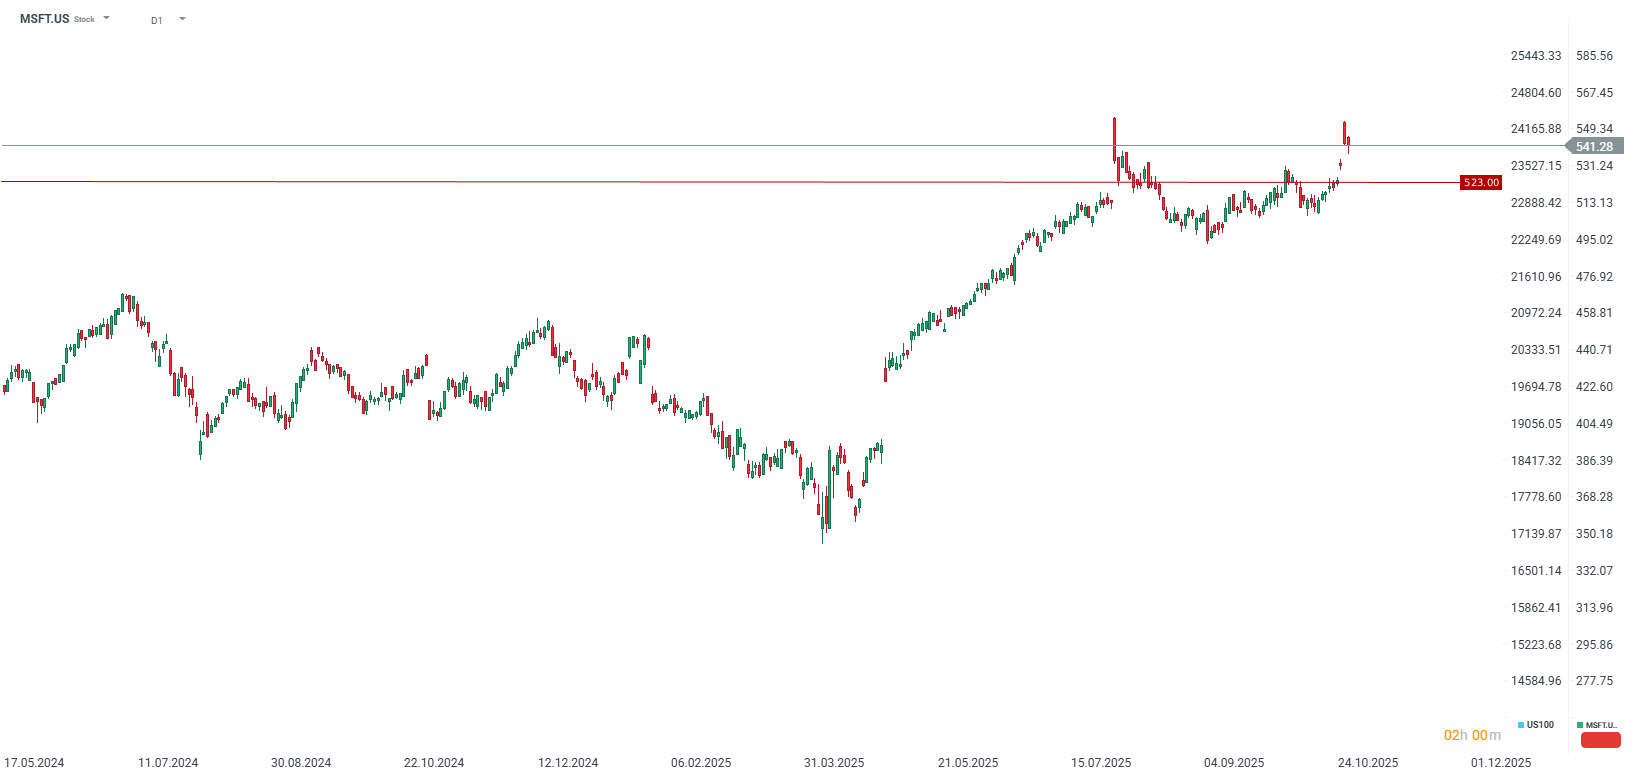
The company's shares lost 3-4% in after-hours trading. Source: xStation5
US OPEN: Powell, MAG7 and Trump mix market's sentiment
Apple Preview: Will Asia spoil the earnings?
Economic calendar - ECB Decision and the Next Wave of Tech Giants' Earnings
🚀 Alphabet Soars on AI-Driven Results, Shares Rally 7% in After-Hours Trading
The material on this page does not constitute as financial advice and does not take into account your level of understanding, investment objectives, financial situation or any other particular needs.
All the information provided, including opinions, market research, mathematical results and technical analyses published on the website or transmitted to you by other means is provided for information purposes only and should in no event be interpreted as an offer of, or solicitation for, a transaction in any financial instrument, nor should the information provided be construed as advice of legal or fiscal nature.
Any investment decisions you make shall be based exclusively on your level of understanding, investment objectives, financial situation or any other particular needs. Any decision to act on information published on the website or transmitted to you by other means is entirely at your own risk. You are solely responsible for such decisions.
If you are in doubt or are not sure that you understand a particular product, instrument, service, or transaction, you should seek professional or legal advice before trading.
Investing in OTC Derivatives carries a high degree of risk, as they are leveraged based products and often small movements in the market could lead to much larger movements in the value of your investment and this could work against you or for you. Please ensure that you fully understand the risks involved, taking into account your investments objectives and level of experience, before trading, and if necessary, seek independent advice.